What guests ask at every stage of a stay


Stay Phase Map
Six phases, eleven guest topics
Guests ask the same things, in the same order, every single stay.
We mapped a year of guest messages onto the phase of the stay they arrived in: eight or more days before check-in, the final week, arrival day, mid-stay, departure day, and after checkout. Every question has a window where it clusters, and those windows do not line up with how most teams are staffed.
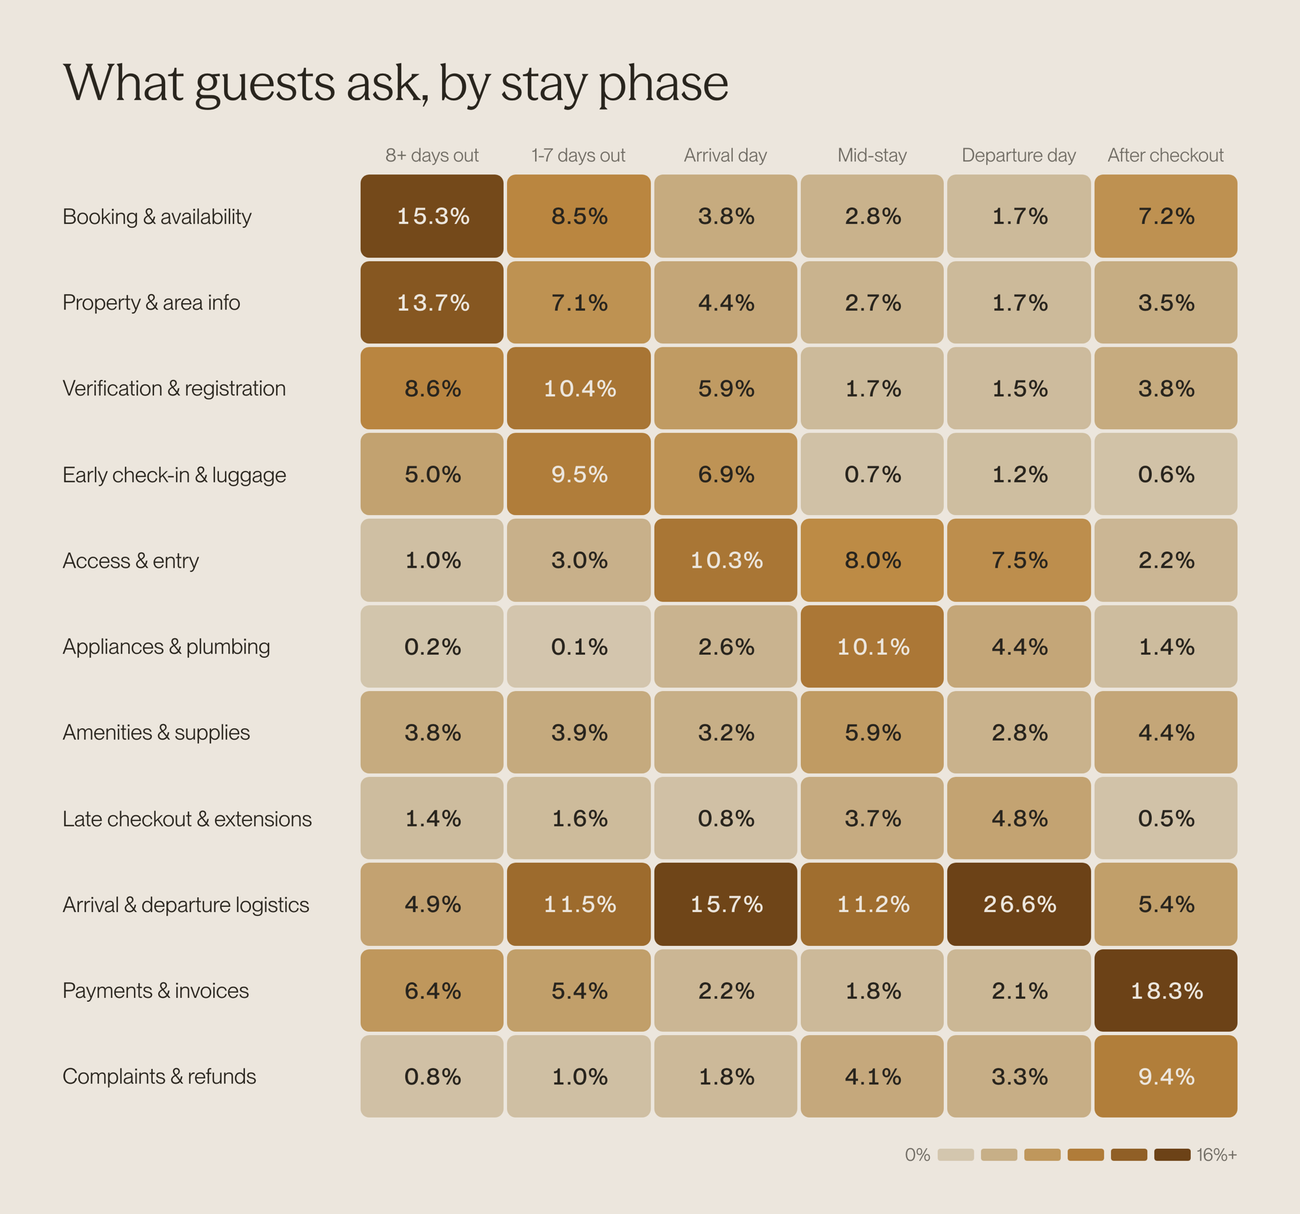
Read each column on its own. The number is that topic's share of everything guests sent in that phase, so a cell is comparable to the cells above and below it and not to the ones beside it. The eleven topics here account for between 53% and 62% of any given column. Most of the remainder is one-line acknowledgements, which are replies rather than requests.
What guests ask in each phase
More than eight days out, they are still deciding. Booking and availability is 15.3% of the window and property and area questions another 13.7%. Nearly a third of everything sent this early is somebody working out whether to book, or what the stay will actually cost them once they arrive.
In the final week, the stay becomes logistics. Arrival and departure logistics 11.5%, verification and registration 10.4%, early check-in and luggage 9.5%. Booking questions have halved.
Arrival day is the biggest phase and it is about doors. It carries 24.4% of everything sent inside a booking window, more than any other phase. Access and entry hits 10.3% here, up from 3.0% in the final week and 1.0% before that.
Mid-stay is when things break. Appliances and plumbing peaks at 10.1%. Complaints reach 4.1%. Access is still at 8.0%, because a code that failed on day one tends to keep failing.
Departure day is one topic. Arrival and departure logistics is 26.6% of it, the single largest cell on the map. Checkout time, key return, luggage and taxis.
After checkout, money. Payments and invoices is 18.3% and complaints are 9.4%, both their highest points anywhere.
The column the heatmap does not show
Shares within a phase are the right way to plan coverage. They are the wrong way to size anything, because the phases are nowhere near the same size.
| Phase | Share of messages tied to a reservation |
|---|---|
| More than 8 days out | 20.3% |
| Final 7 days | 18.8% |
| Arrival day | 24.4% |
| Mid-stay | 22.5% |
| Departure day | 9.6% |
| After checkout | 4.3% |
After checkout is 4.3% of the volume, so complaints running at 9.4% of that phase against 4.1% of mid-stay does not mean most complaints arrive late. Mid-stay produces roughly 63,000 complaints a year at this volume and after checkout produces roughly 27,000. You are already hearing most of them while the guest is still in the building.
So the job is to notice the mid-stay complaints you already get, and to stop the last 27,000 from being the first time you hear anything at all.
Five things I would change
1. Charge for early check-in
Early check-in and luggage drop runs between 5% and 9.5% of every pre-arrival conversation, about 390,000 requests a year at this volume. If you are answering something 390,000 times, it is a product with a price attached, not an interruption.
It also sells better as a box a guest can tick during check-in than as a negotiation over messages. At that point they are already thinking about arrival, and they can see what it costs.
One caveat on the number, because we found it the hard way. Booking.com started injecting a canned check-in-time request into guest threads in February 2026, which shows up as roughly 35,000 early check-in requests a year that no guest actually typed. That is about 9% of the total. The rest are real.
2. Put the seven-day window in a portal
Verification and registration 10.4%, early check-in and luggage 9.5%, arrival logistics 11.5%. That is 31% of the final week, and every one of those three is knowable from the reservation the moment it is made.
None of them need a conversation. ID collection, an early check-in option with a price on it, and directions that open in Maps are form-shaped rather than chat-shaped. Send that as a portal on a day-seven schedule and most of the window resolves itself before a guest types anything.
3. Send a check-in courtesy message
Access and entry is 10.3% of arrival-day messages, about 170,000 messages a year, and 42% of access messages report something broken rather than asking a question. Nobody messages to say the code worked, so silence tells you nothing.
If guests let themselves in, send a short "did you get in ok?" thirty to sixty minutes after the check-in time. It gets ahead of the problem and it shows up in review scores. That is also when your inbox is busiest. The heaviest hour of the day is 3pm local at 7.3% of volume, with 4pm right behind at 7.2%, so a team staffed 9 to 5 is thinnest at exactly the point where access failures land. An access failure nobody catches at 4pm becomes a phone call at 10pm.
It is the topic where automation helps least today. Only 20% of access messages get an AI-first reply, against 30% for logistics, because the ones that matter are reports of a broken thing rather than questions with answers.
4. Send a mid-stay check-in
Complaints run 4.1% of mid-stay messages and 9.4% after checkout. The mid-stay ones are more numerous and they are the ones where a fix still exists. After checkout the only levers left are a refund and a reply to a review that is already written.
The reply times make this worse than it looks. Complaints wait a median of eight minutes for a response. "Thanks, see you Friday" gets answered in two. The messages that represent something broken get the slowest replies in the inbox, because most inboxes sort by arrival time, and a careful answer to a complaint takes longer to write. Complaints, appliances and cleanliness carry problem rates of 94%, 87% and 79%. Those three should never queue behind a pleasantry.
5. Make late checkout easy
Late checkout and extensions is 3.7% of mid-stay messages and 4.8% on departure day, where it is the third largest topic after departure logistics and access. That is about 180,000 requests a year at this volume, roughly half the early check-in volume, and it arrives in the same shape: a yes or no that somebody types out by hand.
Price it or give it away, but decide once and publish the answer rather than negotiating it a few hundred thousand times.
The post-checkout window
After checkout is the smallest phase, 4.3% of the volume, and most operators run it as a receipts desk. Payments and invoices is 18.3% of it and complaints are 9.4%.
The direct-booking opportunity sits later than that. For Conduit customers an agent writes a personalised follow-up about a month after checkout, and those accounts see direct-booking conversations rise about 30% off that one message.
All of this runs on Conduit today. Book a demo if you want it running across your portfolio.
How this was measured
A year of inbound guest messages, August 2025 to July 2026, across 68,625 actively billed short-term rental properties in 78 countries. Counts are normalised to a round 10 million message base; shares, rates and significance tests are unaffected by that scaling.
Topics were not decided in advance. We clustered a random sample of messages into 140 tight groups, read the groups, rolled them up into a taxonomy from what was there, then labelled every message in the sample against it.
Three things to know about the numbers above. About 11% of what lands in these inboxes is not written by a guest at all, and is excluded from every percentage here. Phase figures cover only messages we can tie to a reservation, which is about 70% of the base. And the hour-of-day figures cover the 65% of messages where we can resolve a reliable local time.
The full study, including what changed over the year and what did not, is in what guests ask across 10 million messages. If you are picking software to do any of the above, we keep a running comparison of guest communication tools.

Stay in the loop
Get the latest on AI automation, product updates, and customer stories.

