ADR vs. RevPAR: Which Metric Actually Drives Hotel Profit


ADR vs RevPAR
Which Hotel Metric Matters
Most operators track ADR and RevPAR religiously. Few understand what those numbers are structurally built to hide, and that blind spot is where revenue actually disappears.
ADR and RevPAR sit at the center of nearly every hotel performance review because they translate complex operations into two numbers a leadership team can track.
- The numbers move, the dashboard updates, and leadership gets a clean briefing.
- But tracking a metric and understanding what it is hiding are two different skills, and the gap between them is where revenue quietly disappears.
- ADR and RevPAR sit at the center of nearly every hotel performance review because they translate complex operations into two numbers a leadership team can track.
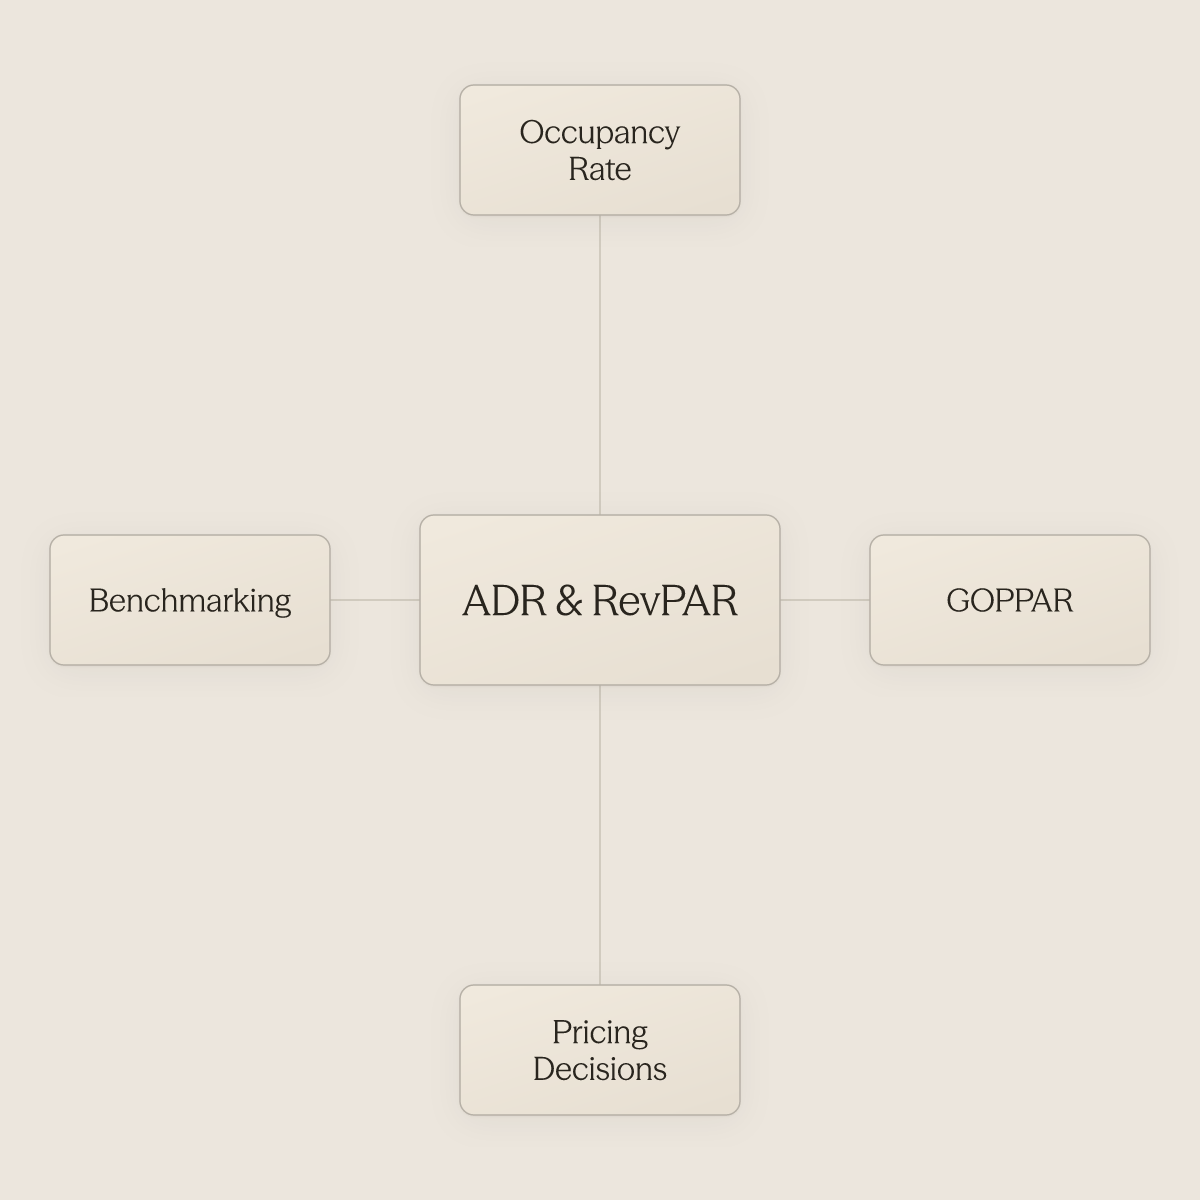
According to industry reporting from AltexSoft (2026), both metrics are treated as primary financial KPIs alongside occupancy rate and GOPPAR, confirming their central role across property types and portfolio sizes. Both metrics are comparable across properties, easy to benchmark against a competitive set, and directly tied to pricing decisions, offering a shared language whether you are reviewing a boutique property or a 300-room full-service hotel. The problem is not the metric. See our AI for hospitality for how this works in practice.
ADR and RevPAR are lagging indicators; they report what already happened. The average gap between performance events and management reporting in hospitality runs days to weeks, meaning by the time a negative trend surfaces in a weekly dashboard, the booking window to correct it has often already closed. This is where the structural blind spot becomes a financial one.
As AltexSoft (2026) notes, ADR measures only revenue earned per occupied room; unoccupied rooms are excluded from the denominator entirely. An operator raising rates while losing occupancy volume can post a healthy ADR figure while total room revenue quietly contracts, a gap that only becomes visible when RevPAR and occupancy are read alongside rate.
The problem is not the metric. The problem is what the metric cannot see.
Key takeaways
- ADR only counts rooms that sold, RevPAR counts every room you had, whether it sold or not. That single design difference is why the two metrics tell completely different stories from the same night's data.
- A hotel can post record ADR while RevPAR quietly collapses, because rate gains mean nothing if occupancy is falling faster than price is rising.
- Selling 5 of 10 rooms at $400 looks strong on a rate report. RevPAR is $200. The metric you optimize determines which half of that picture you see.
- When ADR and RevPAR diverge, that gap is a diagnostic signal, not a reporting artifact. The direction and size of the spread tells you specifically where your rate strategy is breaking down.
- Neither metric captures OTA commission drag, which runs 15–25% of booking value. A clean RevPAR dashboard can mask quietly collapsing net revenue.
- Booking windows have compressed sharply since 2020. The operators closing the revenue gap aren't reading better reports after the window closes, they're responding before it does.
- Conduit's AI-powered guest communication tools give hospitality operators the real-time response infrastructure that turns metric fluency into revenue action, automating guest interactions so teams can move on rate and occupancy signals before the opportunity is gone.
What Is ADR and How Is It Calculated?
That definition level is precisely where the 2023 and 2024 headline numbers became misleading. STR and CoStar data showed year-over-year rate gains across economy to luxury tiers, and record ADR figures dominated industry coverage. Yet occupancy softened even as rates climbed, and total room revenue told a different story than the ADR line alone suggested. What ADR actually measures, and what it is structurally incapable of seeing, determines whether those headline gains represented real revenue progress or a more complicated outcome hiding beneath them.
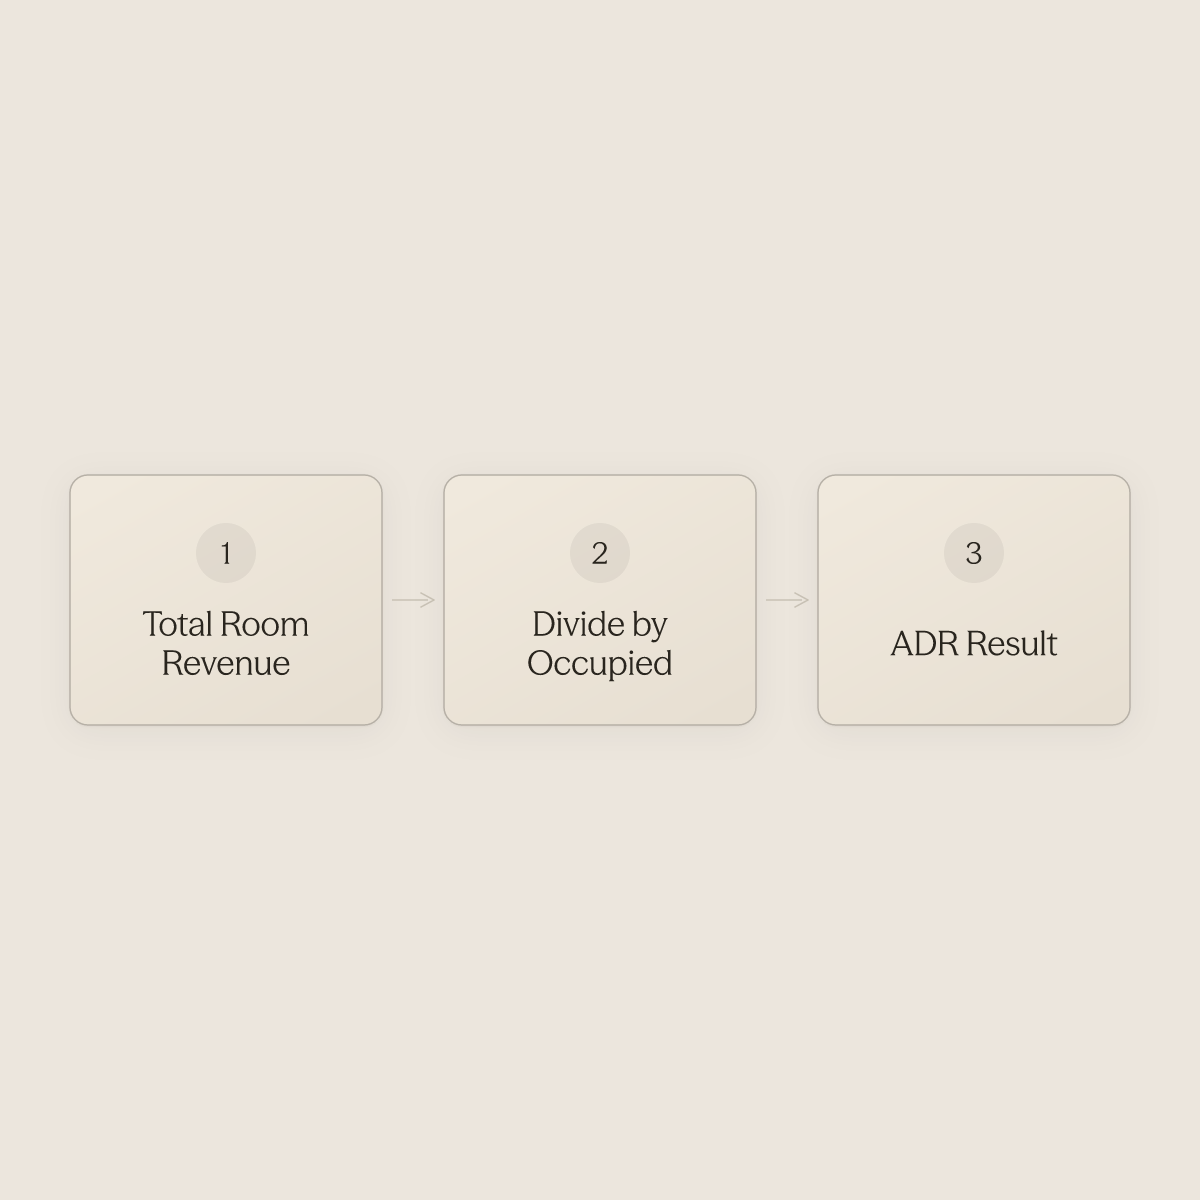
ADR Defined - The Revenue You Earned From Rooms Guests Actually Booked
Average Daily Rate (ADR) is the average revenue earned per occupied room in a given time period. Per STR benchmark data, the formula is: ADR = Total Room Revenue divided by Number of Occupied Rooms. If your property generates $12,000 in room revenue on a night when 60 rooms are occupied, your ADR is $200. That number tells you precisely what paying guests were willing to spend for the rooms they booked. Nothing more, nothing less.
The Limits of ADR as a Standalone Signal
ADR's precision is also its constraint. Because it measures only rooms that sold, it cannot tell you how many rooms sat empty, whether a rate increase suppressed demand, or how your total inventory performed relative to the market. For those questions, RevPAR is the right instrument, and the relationship between the two numbers is where the most useful diagnostic signal lives.
There is a subtler distortion worth naming directly. One of the real challenges operators and analysts face is that certain properties artificially inflate their published cash rates in order to reach higher reimbursement tiers from loyalty program partners, pushing ADR upward in a way that reflects a billing strategy rather than genuine pricing strength. When that happens, ADR appears misleadingly high, and any benchmarking exercise built on it inherits the distortion.
CoStar's STR press releases provide market-level ADR context, but even clean aggregate data cannot flag whether a specific property's rate has been engineered to hit a reimbursement threshold rather than to reflect true demand. That gap, between what ADR reports and what actually drove the number, is where operators relying on a single metric get into trouble.
ADR Formula and the Denominator That Changes Everything
The denominator is where ADR's structural limit lives. Only occupied rooms appear in the calculation, unsold inventory is invisible. A property that sells 60 rooms at $200 posts the same ADR as one that sells 40 rooms at $200. The ADR is identical; the revenue is not: $12,000 versus $8,000. ADR was built to measure rate effectiveness, not capacity performance.
What ADR Is Genuinely Good At - Pricing Strategy, Channel Mix, and Rate Segmentation
ADR earns its place when the question is specifically about pricing. STR and CoStar segment ADR by property tier, and the spread is significant: luxury properties routinely post ADRs three to four times higher than economy properties, reflecting how brand positioning and guest mix shape rate outcomes. ADR also surfaces channel-level pricing differences clearly.
Direct bookings consistently carry higher net ADR than OTA bookings once commission costs are factored in, making channel mix one of the most actionable levers an operator can pull. Demonstrating measurable improvements in guest satisfaction metrics to leadership, a goal most revenue managers share, requires pairing ADR trends with the guest-communication data that sits beneath them. That is where operational tools matter: when a property's guest communications run across multiple platforms simultaneously, inconsistencies in rate messaging, loyalty inquiry handling, and post-stay follow-up compound quietly until they surface in satisfaction scores.
Conduit's AI Agents are most beneficial precisely in that environment, high volume of repetitive guest messages, existing SOPs or FAQs to train on, and the Inbox layer gives operations teams a single place to monitor every conversation the agent is handling, before, during, or after a stay. Integrations with tools like Notion, Google Drive, or Airbnb mean the agent draws on existing content without requiring manual re-entry, keeping rate and policy communications accurate and consistent across channels. When ADR analysis flags a channel-mix problem, that operational consistency is what closes the loop between the number on the report and the guest experience that produced it.
What Is RevPAR and How Is It Calculated?
ADR tells you what sold; RevPAR tells you what the whole building actually earned, and the gap between those two numbers is where occupancy losses quietly compound before anyone flags them. Understanding how RevPAR is calculated, and why its formula forces empty rooms into the equation, is what separates a rate report from a genuine performance diagnosis. That distinction matters whether you are reviewing last quarter or building the case for a pricing change.
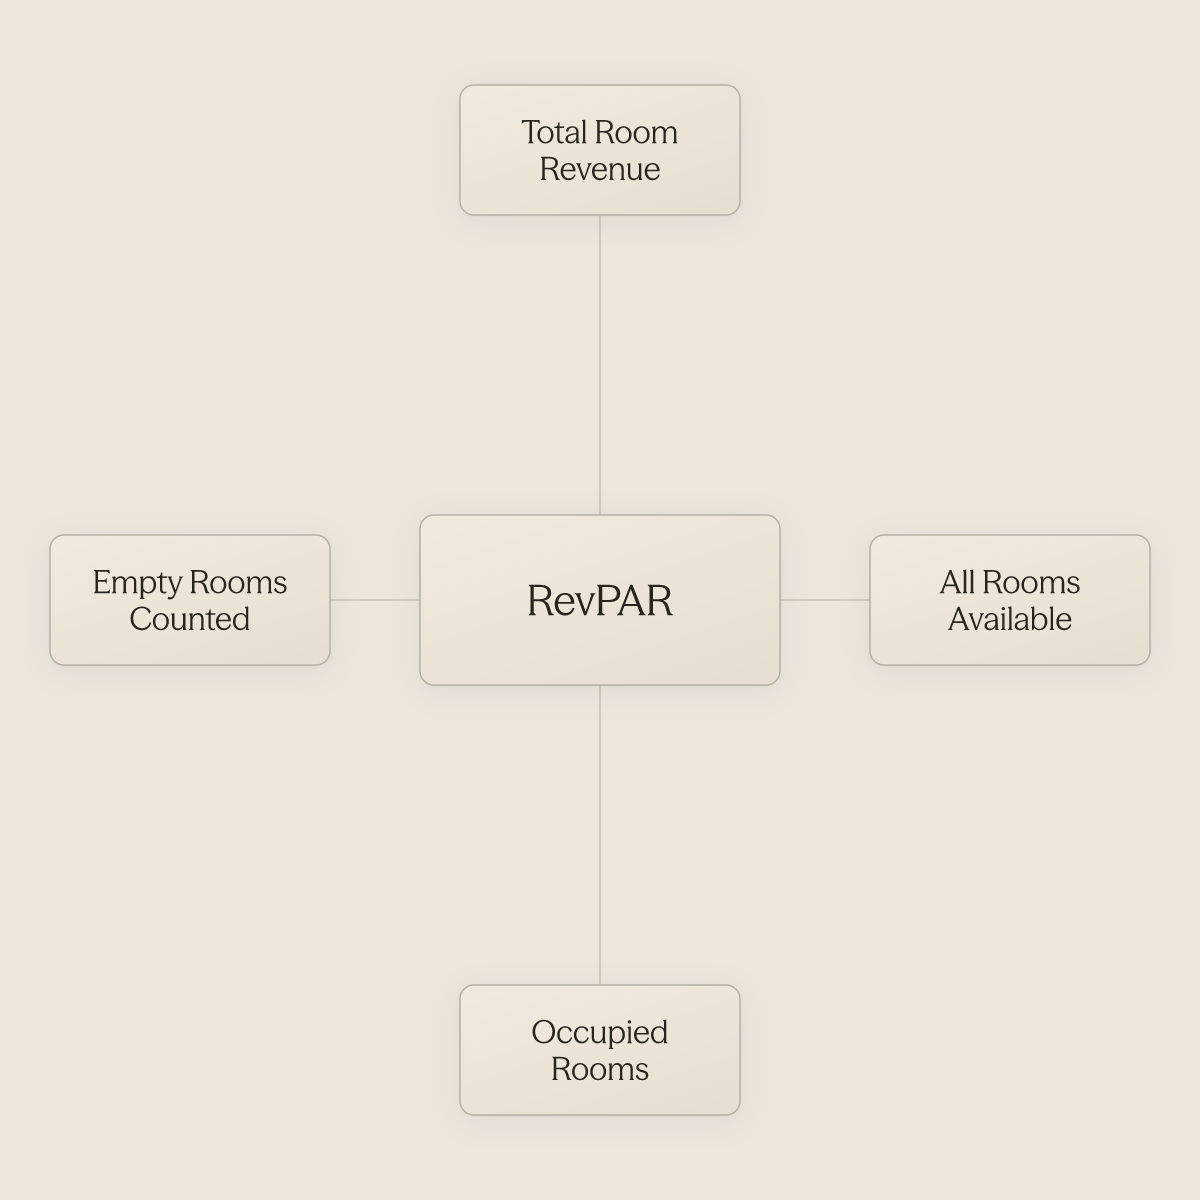
RevPAR Defined - The Metric That Counts Every Empty Room Against You
Revenue Per Available Room measures total room revenue divided across every room in inventory, occupied or not. As STR benchmarking data makes clear, that single design choice separates RevPAR from every other standard rate metric. ADR only sees rooms that sold.
RevPAR sees the whole building, which is why a property can post a record ADR quarter while its RevPAR quietly slides if occupancy is falling simultaneously. Operators managing distributed portfolios often discover this gap in a post-mortem rather than a pricing adjustment, and presenting that finding to leadership requires more than a rate report. Demonstrating measurable improvements in guest satisfaction and capacity efficiency metrics is precisely the kind of evidence that moves leadership to act on pricing strategy rather than wait for the next post-mortem.
Take an 80-room hotel generating $12,000 in room revenue on a given night. RevPAR = $150. The second formula, RevPAR = ADR multiplied by Occupancy Rate, produces the same number but reveals something the first formula hides.
If ADR is $200 and occupancy is 75 percent, RevPAR is $150. Drop occupancy to 60 percent without touching rate, and RevPAR falls to $120, a 20 percent revenue loss that never appears in your ADR report. The second formula makes the occupancy cost visible, which is why revenue managers prefer it for diagnosing performance, not just reporting it.
What RevPAR Is Built For - Benchmarking, Capacity Efficiency, and Comp-Set Position
RevPAR's real power is comparative. Because it accounts for both rate and occupancy, it creates a level playing field for benchmarking against a competitive set. Two properties can charge identical ADRs and look like peers on a rate report; their RevPAR immediately surfaces which one is filling rooms and which is not.
CoStar's STR methodology uses RevPAR as the foundation for comp-set indexing precisely because it captures capacity efficiency in a single number. For multi-property operators, a portfolio-level RevPAR can look healthy while one or two underperforming properties drag total capacity efficiency, a divergence that only surfaces when RevPAR is tracked at the individual asset level, not just rolled up to the portfolio average. That same operational blind spot compounds when guest communications are fragmented across properties.
Conduit's Inbox is most beneficial when managing guest communications across multiple platforms or properties simultaneously, giving operations and support teams a single place to monitor, review, and manage every conversation the AI agent is handling, ongoing, across the entire portfolio. When leadership asks for evidence of capacity efficiency improvements, having clean, centralized communication data from every property is exactly the kind of measurable operational signal that demonstrates progress beyond the RevPAR line alone.
ADR vs. RevPAR - Key Differences: and Why the Wrong One Gets Optimized
Selling 5 rooms out of 10 at $400 a night looks great on the rate report. But that hotel's RevPAR is $200, because five rooms sat empty and generated nothing. That worked example, drawn from AltexSoft's analysis of hotel performance metrics, captures the entire problem with single-metric optimization: the number you're watching can look healthy while the number that actually matters is quietly bleeding out.
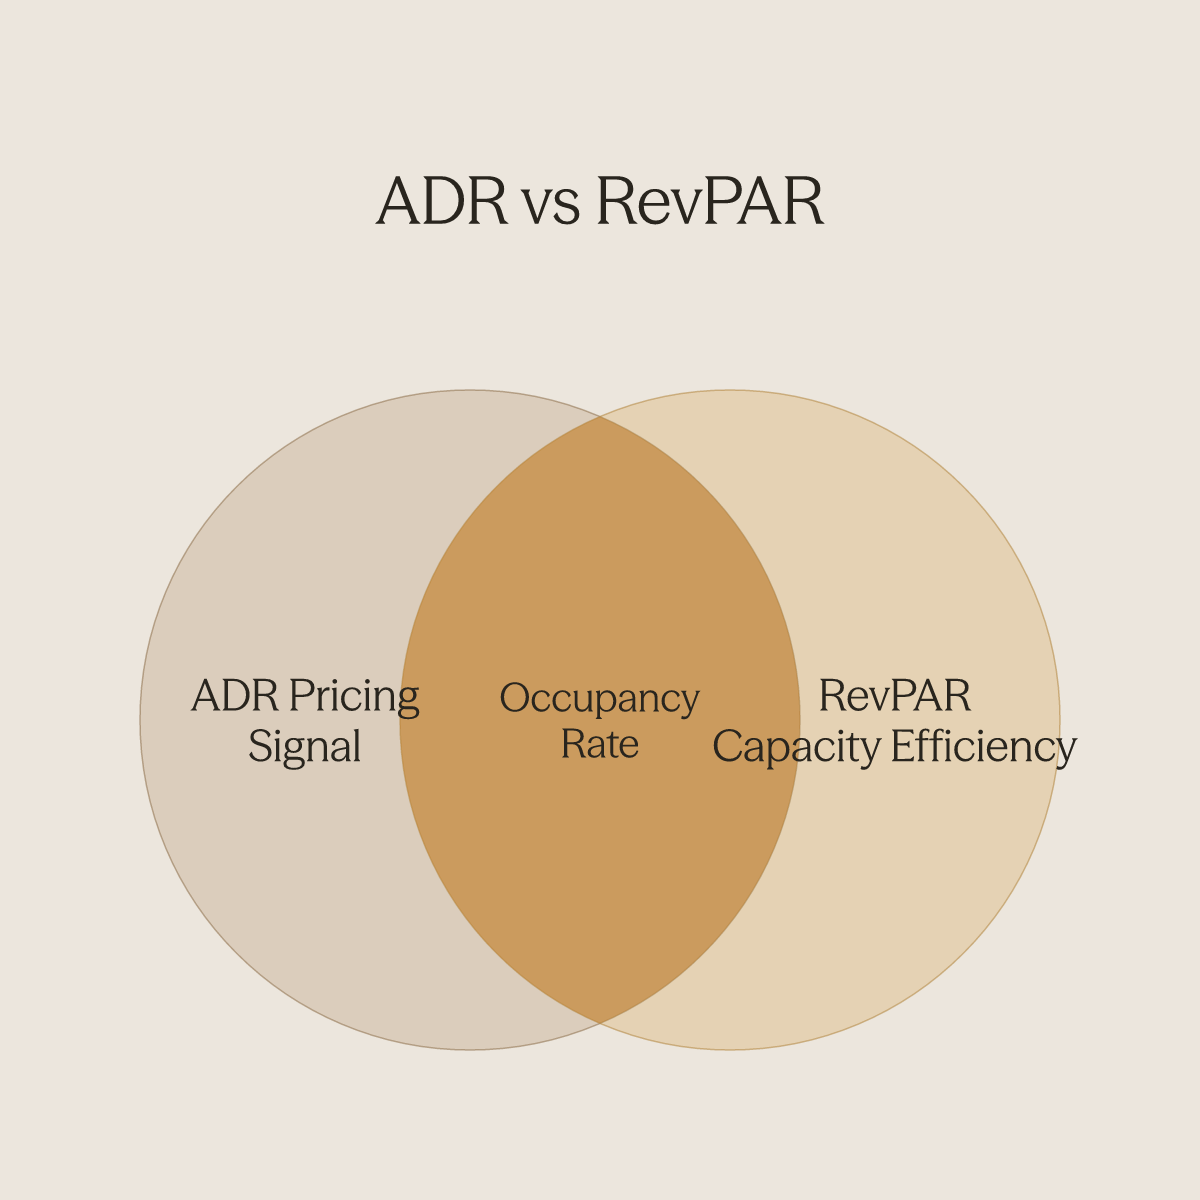
ADR Is a Pricing Metric; RevPAR Is a Capacity Efficiency Metric
ADR tells you the average rate you collected on rooms that sold. RevPAR tells you how efficiently your entire inventory converted into revenue, whether rooms sold or not. The formula makes the relationship explicit: RevPAR = ADR multiplied by occupancy rate.
Occupancy is the link between them, and it is also the variable most operators underweight when reading either number in isolation. A rising ADR is a pricing signal. A rising RevPAR is a capacity efficiency signal.
The rate story and the volume story are both real; neither is complete without the other. This distinction carries especially high stakes for a specific class of operators right now. All-in development costs for luxury properties have risen sharply, making new greenfield development increasingly untenable and pushing investors toward historic renovations that can command higher ADRs.
When your entire investment thesis is built on rate, not volume, the temptation to optimize for ADR alone becomes structural, not just analytical. That is precisely when the RevPAR blind spot is most dangerous.
Worked Comparison - Two Hotels, Same ADR, Opposite Revenue Outcomes
Hotel A charges $250 per night and runs at 50% occupancy, producing a RevPAR of $125. Hotel B charges $180 per night and runs at 85% occupancy, producing a RevPAR of $153. On a 100-room property over 30 nights, that gap compounds into a material difference in total room revenue. With hotel occupancy averaging well below full capacity nationally, meaning the spread between achievable ADR and actual RevPAR is a real operating condition at most properties, not an anomaly. One underappreciated driver of that occupancy gap is response latency.
Booking inquiries that land overnight or after hours, when no one is at the desk, routinely go unanswered long enough for the guest to book elsewhere. Every unconverted inquiry is an empty room that never appears on the ADR report but quietly destroys RevPAR. Conduit's AI Agents are most beneficial precisely here: when a business receives a high volume of repetitive guest or customer messages and has existing documentation, SOPs, FAQs, manuals, the agent can be trained to deliver its first automated guest reply within days of connecting those materials, capturing every booking inquiry including the ones that land overnight or after hours.
The False-Confidence Trap - What Each Metric Hides When Tracked Alone
A strong ADR reading can mask occupancy erosion for weeks before total revenue deterioration becomes visible. A rising RevPAR can hide the opposite problem: aggressive discounting that fills rooms but quietly destroys rate integrity over time. What most operators find, across property types and price points, is that properties discounting to chase occupancy risk undermining rate parity and long-term pricing power, even as their RevPAR line holds steady or climbs.
That gap is compounded for operators managing guest communications across multiple platforms or properties simultaneously, where the sheer volume of touchpoints makes manual monitoring of booking pace and inquiry conversion practically impossible. Conduit's Inbox is designed for exactly that condition: used by the operations or support team to monitor, review, and manage all conversations the AI agent is handling, across every channel, continuously, so that the demand signal buried inside guest message patterns is never invisible. Getting off the 24/7 on-call treadmill and back to growing the business starts with ensuring that neither a metric dashboard nor an unanswered inquiry is quietly working against you at the same time.
When to Use ADR vs. RevPAR: and How to Use Both Together
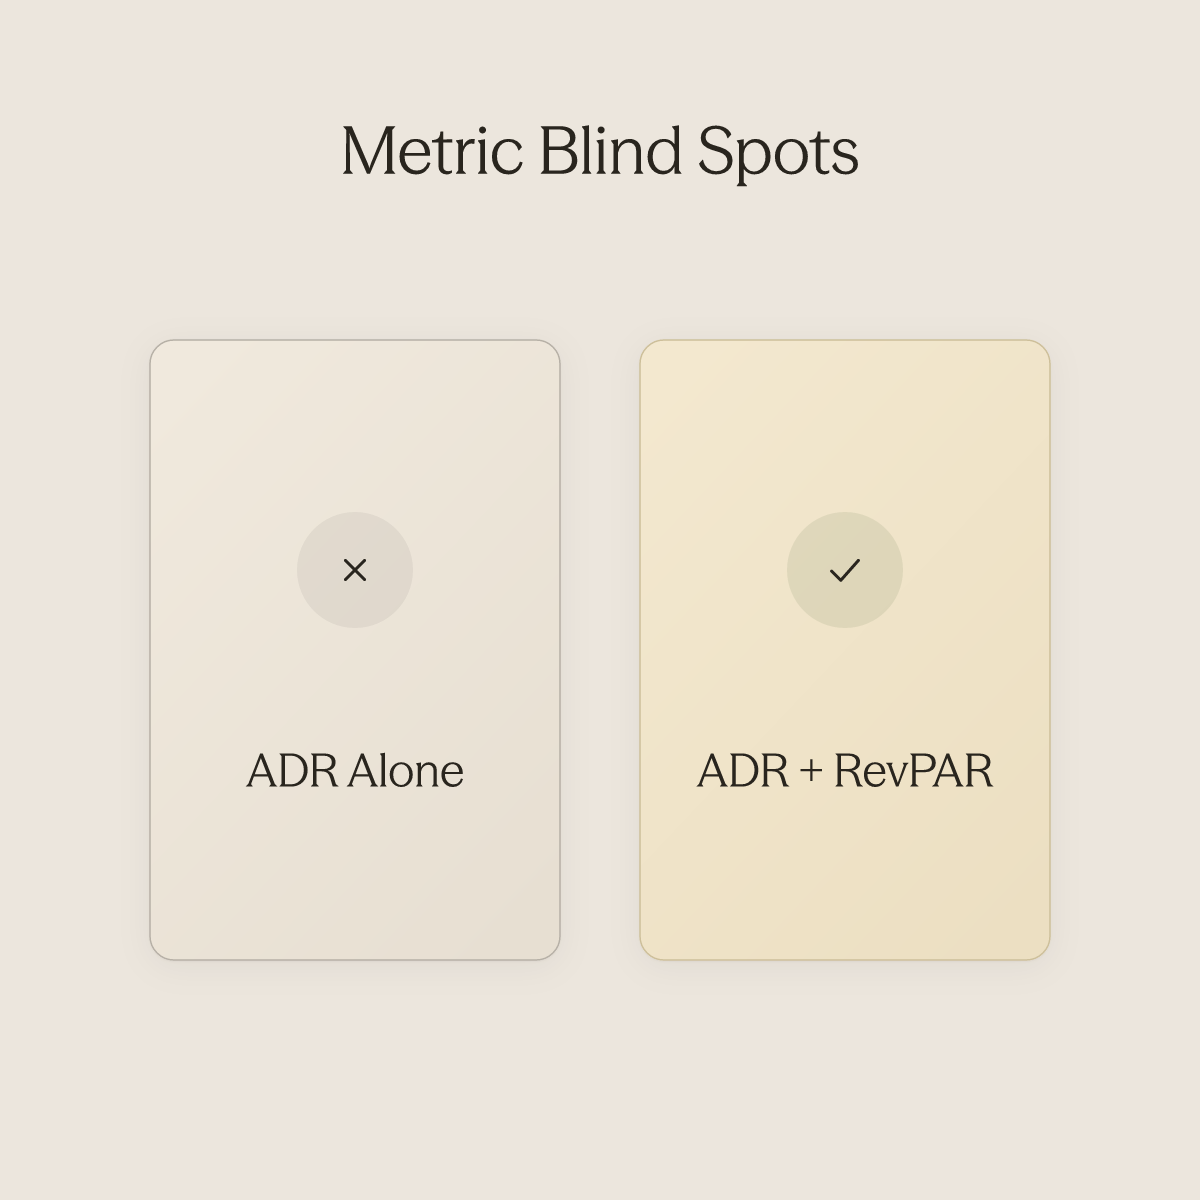
The direction ADR and RevPAR move relative to each other is more diagnostic than either number on its own. When they diverge, that gap is telling you something specific about where your rate strategy is breaking down. The operators who act on that signal fastest are not running more reports; they are reading the relationship between the two metrics in real time and moving the right lever before the booking window closes.
The core reason operators chronically optimize the wrong metric is not analytical error, it is a structural blind spot built into how these numbers are calculated: ADR excludes unsold rooms entirely, RevPAR includes them, and neither captures the occupancy momentum or booking pace that would indicate which lever is actually failing in real time. One pattern that compounds this blind spot is purely operational: teams working across multiple platforms, Airbnb, their PMS, channel managers, and internal docs stored in Notion or Google Drive, often find themselves re-entering the same data into multiple places before they can even begin reading the metrics. Conduit's integrations are built specifically for this situation, allowing the AI agent to pull from existing content across those tools without manual re-entry, so the diagnostic conversation can start from live, connected data rather than a spreadsheet assembled after the fact.
Reach for ADR When the Question Is About Pricing Power
Use ADR to evaluate whether your pricing strategy is working, not whether your property is healthy overall. ADR answers a precise question: given the rooms you actually sold, what rate did you achieve? That precision makes it the right tool for channel mix decisions.
A common stumbling point for operators newer to revenue management is conflating ADR with a health indicator, treating a strong rate number as confirmation that the property is performing well overall, when it may simply reflect that low-demand rooms went unsold entirely. Research published in PMC reinforces that ADR measures rate achievement on sold inventory only, which means it will look flattering even as occupancy quietly deteriorates. OTA bookings generate meaningfully lower net ADR than direct bookings once commissions are stripped out, meaning a channel mix shift toward OTAs can quietly erode rate performance even when headline ADR looks stable.
Conduit's AI agents are most valuable precisely here, trained on existing SOPs and FAQs to enforce channel-level rate discipline consistently, without requiring a revenue manager to manually audit each platform.
Reach for RevPAR When the Question Is About Competitive Position
RevPAR is the right metric when the question shifts from "how well did we price?" to "how efficiently are we monetizing total inventory relative to the market?" The RevPAR Index (your RevPAR divided by the comp set average) is the standard tool for that benchmarking conversation, and it is widely used as the primary competitive performance indicator across enterprise hotel operations globally.
The pain of a RevPAR drop is not abstract. When visitor volume falls, RevPAR deteriorates immediately and visibly, because the metric captures the full occupancy-rate relationship that ADR alone obscures. That is precisely why RevPAR, not ADR, is the number operations teams should be monitoring in real time across properties. Conduit's Inbox gives the operations team a single place to monitor all AI-handled conversations, making it easier to catch demand signals (cancellations, date-change requests, low-intent inquiries) that are early indicators of occupancy erosion before RevPAR confirms it in the next reporting cycle.
The Divergence Signal
The most important signal in hotel revenue management is not a high number in either column; it is the direction of divergence between the two. What most teams report bears this out:
- A rising ADR accompanied by falling occupancy is a direct warning that the rate increase is eroding demand; in that scenario RevPAR will be flat or declining even as the rate report looks strong.
- The inverse is equally dangerous: rising RevPAR driven by heavy discounting can mask rate integrity problems that take months to unwind once rate parity erodes across channels.
A further complication beginners we work with consistently encounter is not knowing which of these two metrics their system is already calculating versus which one they need to derive, leading to redundant effort and, worse, acting on a number pulled from the wrong column. Conduit's integrations address the upstream version of this problem: when your SOPs, pricing rules, and channel data already live in Notion, Google Drive, or Airbnb, the AI agent can leverage that content directly, so the team is working from a single connected source rather than reconciling outputs from disconnected tools. For complex multi-property operations with differentiated pricing policies per property, the AI agents can be configured to reflect those specific brand standards and escalation policies, ensuring the right lever is identified for the right property, not a one-size-fits-all response.
Quick-Reference - Which Metric to Reach For and When
"Learners studying hotel KPIs like ADR and RevPAR often lack clarity on when to apply each metric contextually, as the content groups them together without distinguishing their individual use cases or how they interact."
| Situation | Primary Metric | Why |
|---|---|---|
| Evaluating a rate increase or promotional discount | ADR | Measures rate effectiveness on rooms that actually sold |
| Benchmarking against a competitive set | RevPAR | Accounts for both rate and occupancy on all available inventory |
| Diagnosing occupancy erosion while rates hold | RevPAR (via ADR × Occ formula) | Surfaces the occupancy cost invisible in ADR alone |
| Assessing channel mix (OTA vs. direct) | ADR by channel | Net ADR differences become actionable at the channel level |
| Portfolio-level capacity efficiency review | RevPAR Index | Normalizes performance across properties of different sizes and tiers |
| Investigating margin compression despite stable RevPAR | GOPPAR | Captures distribution costs and operating expenses RevPAR excludes |
Related Reading
- Hotel Budgeting And Forecasting
- Hotel Demand Forecasting
- How To Improve Hotel Operations
- How To Increase Revpar
- Hotel Upselling
- Hotel Revenue Management Strategies
- Automated Hotel Reservation System
- Hotel Guest Messaging
- Hospitality Automation
- Hospitality Operations Management
Limitations of ADR and RevPAR - What Neither Metric Can Tell You
The common assumption among heads of operations and VPs of operations at multi-brand and enterprise hospitality groups is that if they track ADR and RevPAR closely enough, they will catch performance problems early and know which lever to pull to recover revenue. A clean RevPAR dashboard can feel like proof that the property is performing. The number is up, the rate looks strong, and the weekly report confirms the story leadership wants to hear.
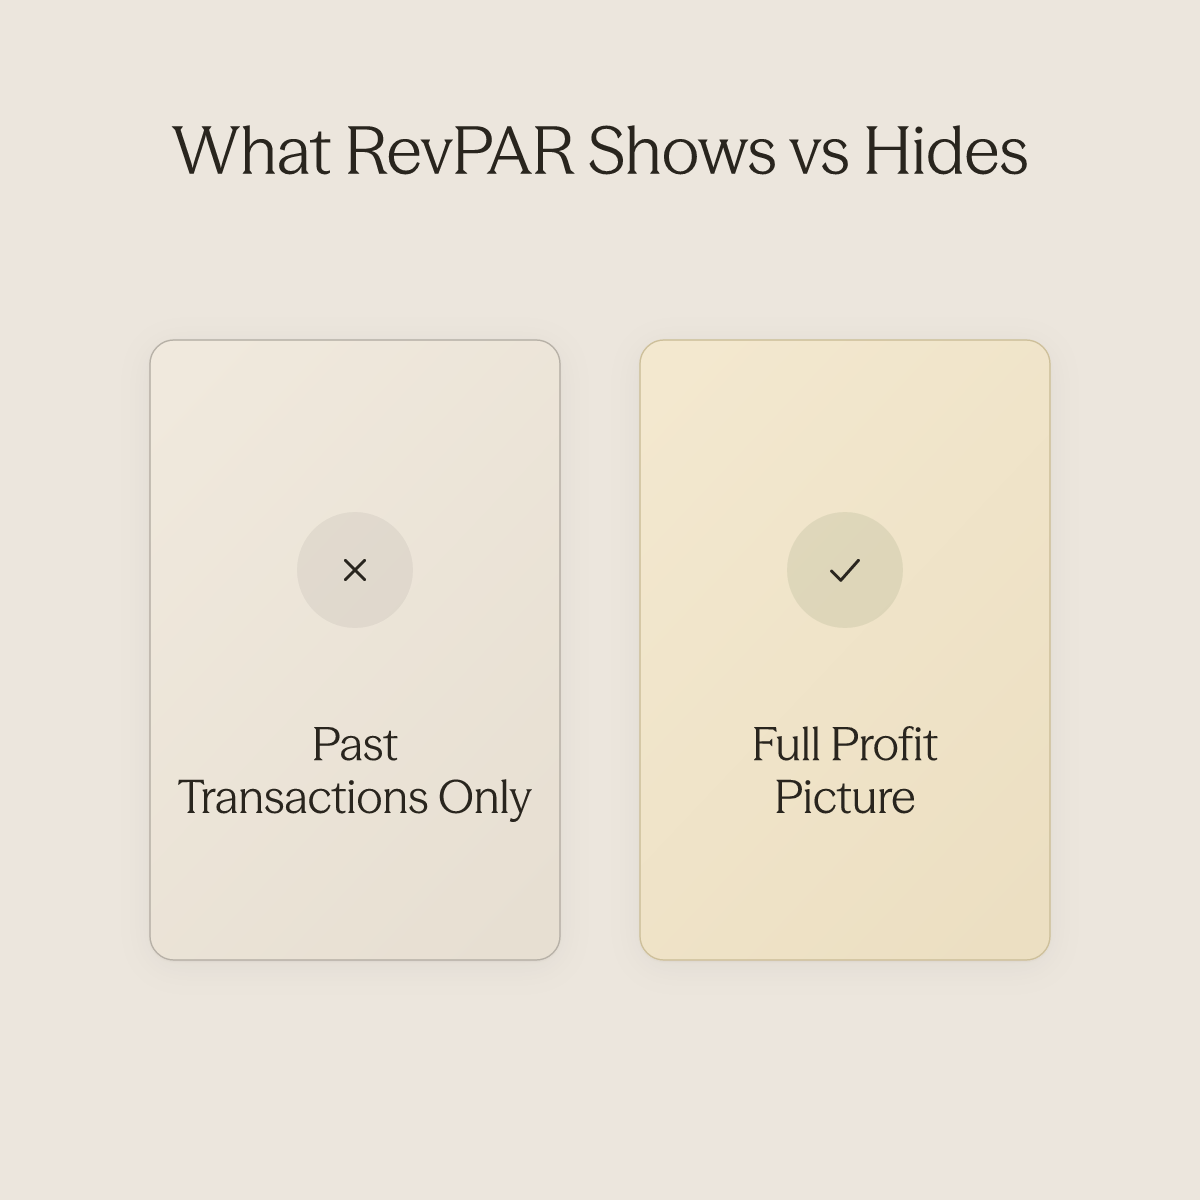
But RevPAR and ADR are structural mirrors of past transactions, not diagnostic windows into what is breaking right now. For a VP of Operations accountable to a portfolio, understanding their limitations is the difference between catching a margin problem in time to act and explaining it in a post-mortem. What makes this harder in practice is that the metrics leadership tracks most closely, ADR and RevPAR, say nothing about the cost of acquiring each booking, the profitability of each guest, or how that guest experienced the property.
Operations leaders who manage guest communications across multiple properties simultaneously know the operational pressure that creates: volume compounds, manual review lags, and by the time a satisfaction problem surfaces in a post-stay survey, the revenue window has already closed. Demonstrating measurable improvements in guest satisfaction metrics to leadership requires visibility that neither ADR nor RevPAR provides.
Neither Metric Touches Profitability
A property can post RevPAR growth of 8% year-over-year while GOP margin quietly contracts, because neither metric registers what it cost to generate that room revenue. OTA commission rates typically range from 15% to 25% of booking value, corroborated by Cloudbeds, meaning a meaningful share of room revenue is paid out before a single operating expense is counted. A hotel shifting channel mix toward OTAs will show identical or stronger ADR and RevPAR while net revenue per booking erodes.
GOPPAR (gross operating profit per available room) is the corrective lens. It absorbs distribution costs, labor, and overhead into a single per-room figure, exposing margin erosion that RevPAR never surfaces. This is also where guest communication costs hide.
When a high-OTA-commission booking arrives, the property has already surrendered 15–25% of room revenue before the guest checks in. If the pre-arrival and in-stay experience then requires disproportionate staff hours to manage, repeated questions, manual follow-ups, unresolved touchpoints across platforms, the true cost of that booking is higher still, and none of it appears in the RevPAR line. AI agents that handle the high volume of repetitive guest messages before, during, and after a stay, drawing on existing SOPs, FAQs, and manuals, compress that hidden labor cost without degrading the guest experience.
Mayra, Global Head of Customer Experience at Wynwood House, described the result directly: "The first thing we noticed was the quality of the AI replies. You cannot tell the difference between an AI agent and a human agent. I work with ChatGPT and other AI tools every day, and sometimes you can immediately tell it's AI. With Conduit, we're not seeing that." That quality threshold matters for margin: guest communications that feel unresolved or robotic generate escalations, which generate labor hours that RevPAR never registers as a cost.
Non-Room Revenue Is Completely Invisible
Neither ADR nor RevPAR accounts for non-room revenue, including food, beverage, spa, and ancillary upsells. For full-service and resort properties, those streams represent a material portion of total guest spend. A guest who books a high-rate room and spends nothing on-property contributes less total revenue than a moderate-rate guest who converts on dining, spa, and late checkout.
Both metrics treat those guests identically. TRevPAR (total revenue per available room) exists to close this gap, but operators anchored to ADR and RevPAR dashboards never see the non-room leakage. The mechanism that drives non-room conversion is the guest touchpoint, and touchpoints that happen manually, late, or inconsistently across properties are touchpoints that do not convert.
Automated workflows triggered after a booking is confirmed, after check-in, or when a specific keyword is detected in a conversation create the recurring, predictable guest interactions that currently require manual staff action and frequently go unmade at volume. When those workflows draw on existing content in tools the operations team already uses, Notion, Google Drive, Airbnb, the lift of deploying them is low and the revenue surface they open is real. What the RevPAR dashboard reports as a flat week may in fact be a week in which ancillary revenue was left on the table at every unreached touchpoint.
Neither metric will tell you that. The inbox and the conversation record will.
The Operational Layer That Actually Moves ADR and RevPAR at Scale
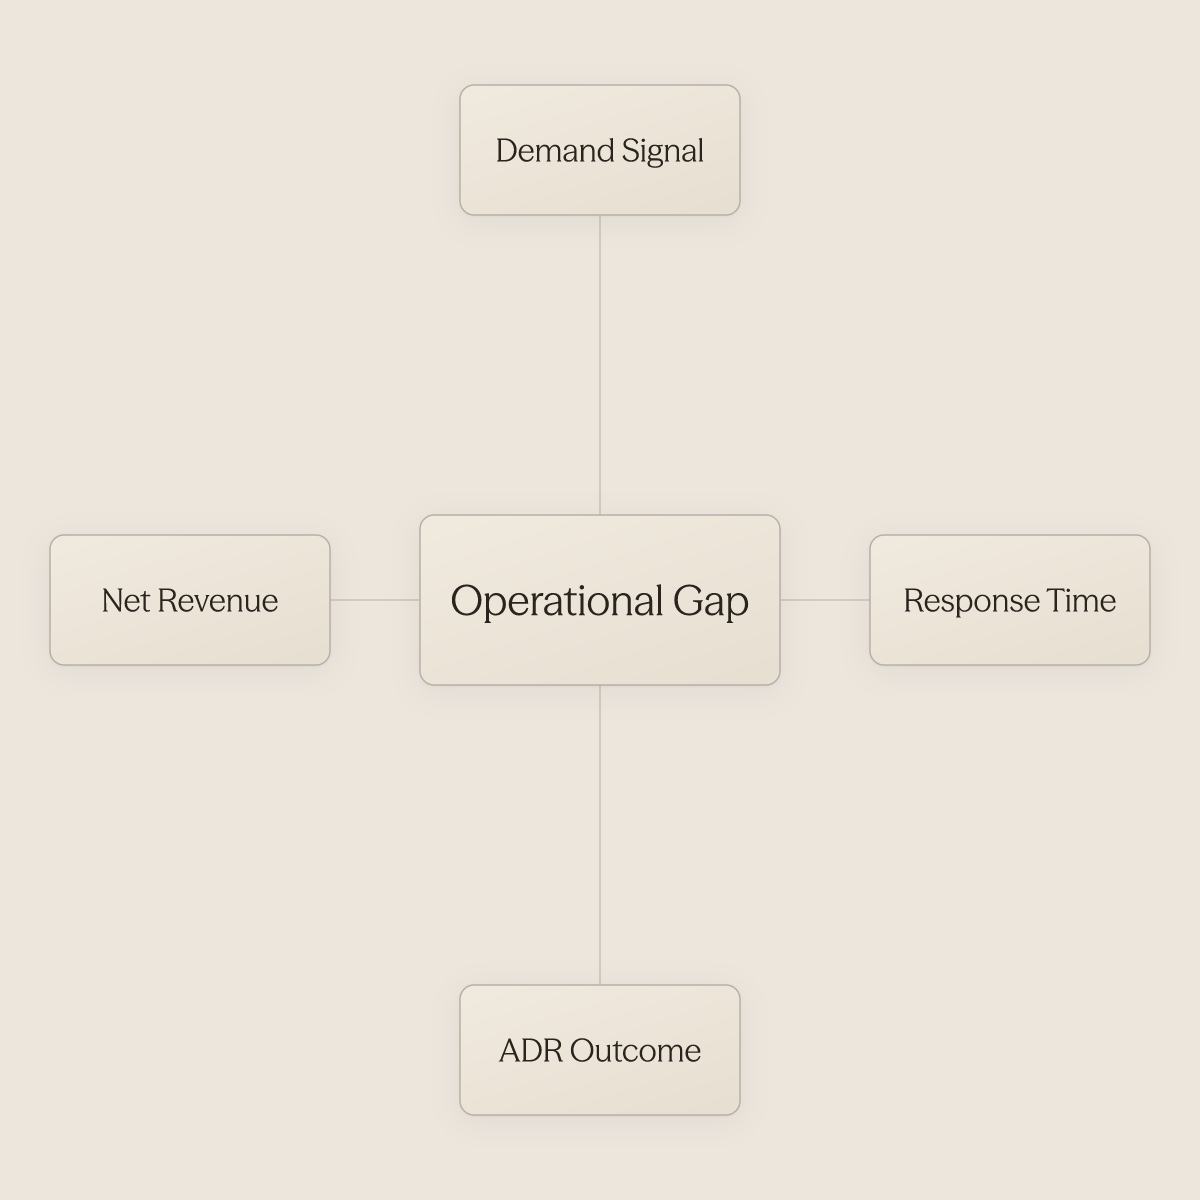
Watching your ADR hold steady while RevPAR quietly softens is one of the most disorienting signals in hospitality operations. The numbers look defensible in a leadership review, but something is clearly leaking. The deeper problem is that a hotel can simultaneously post healthy ADR, stable RevPAR, and quietly collapsing net revenue, because OTA commission costs (15–the same pattern holds. The operators who close that gap fastest have figured out what the rate-strategy playbook never addresses: the bottleneck is not the price, it is the time between a demand signal and an operational response.
Why ADR and RevPAR Are Outcome Metrics, Not Levers
ADR and RevPAR report what already happened. A property can post a healthy ADR while occupancy quietly erodes, and a rising RevPAR can mask rate integrity problems if discounting is what filled the rooms. The metric confirms the outcome; the operational layer shapes it.
Treating a dashboard dip as the problem, rather than as evidence of a problem that already passed, is where most recovery plans start too late. There is a parallel structural tension that multi-property operators know well: scaling request volume through digital ordering and venue management tools generates more demand than floor staff can physically fulfill. The same physics apply to guest communications.
More properties, more channels, more inquiries, and a fixed team configuration that degrades at exactly the moments it cannot afford to. The coordination ceiling arrives before the revenue ceiling, and the gap between them is where ADR and RevPAR quietly erode.
The Three Operational Levers That Directly Influence ADR and RevPAR in Real Time
Rate strategy sets the ceiling. Three operational factors determine whether you reach it. Industry data shows fast response times boost bookings by 116% for short-term rental operators.
While that figure is specific to short-term rentals, the conversion mechanic, faster response preserving higher-rate direct bookings before guests default to OTA channels, applies directly to hotel and multi-property contexts. Slow response times are not a service-quality problem in isolation; they are a revenue leakage problem, because every delayed reply is a window in which a guest resolves the friction themselves by booking through an OTA instead. Conduit's AI Agents are designed to eliminate this bottleneck: once trained on existing SOPs, FAQs, and manuals, they begin delivering automated guest replies within days of connecting that documentation, and they respond continuously, before, during, and after a stay, including late-night inquiry surges when human teams are at their thinnest.
Ancillary revenue per booking remains significantly undercaptured across multi-property portfolios. RevPAR is leaving money no pricing algorithm touches. Conduit's Workflows fire automatically after trigger events in the guest lifecycle, after booking confirmation, after check-in, or when a specific keyword is detected, turning what was previously a manual, easy-to-skip staff action into a consistent, repeatable revenue touchpoint at every property in the portfolio.
Last-minute occupancy holes require a response measured in minutes, not the hours a weekly report takes to surface them. The Inbox layer, used by operations and support teams to monitor, review, and manage all conversations the AI agent is handling, gives multi-property teams a single surface to catch the signals that would otherwise surface too late to act on.
The Headcount Wall - Where Multi-Property Teams Hit a Staffing Ceiling Before a Revenue Ceiling
The structural problem is not that ops teams lack skill, it is that guest communication volume scales with the portfolio in ways that no fixed team configuration handles gracefully. Response speed degrades most at the worst moments: peak demand periods, late-night inquiry surges, and multi-channel volume spikes. The coordination ceiling arrives before the revenue ceiling, and that gap is where ADR and RevPAR quietly erode, not because the team isn't capable, but because the structure makes real-time response at scale impossible without the right infrastructure.
Conduit is most beneficial precisely at this inflection point: when managing guest communications across multiple platforms or properties simultaneously, and when the business receives a high volume of repetitive guest messages and already has documentation, SOPs, FAQs, manuals, that an AI agent can be trained on. For operations with specific brand standards, escalation policies, or complex multi-property structures that require differentiated agent behavior, the Operator configuration layer allows those rules to be encoded directly, so the AI behaves according to the portfolio's actual standards rather than a generic default. Integrations with tools like Notion, Google Drive, or Airbnb mean existing content doesn't need to be manually re-entered, the agent can leverage it as-is, reducing the setup cost that otherwise delays go-live.
The outcome is the ability to scale the portfolio without proportionally increasing coordination headcount, and to eliminate the operational bottleneck of around-the-clock guest communication, the two structural constraints that, left unaddressed, ensure the revenue ceiling is always lower than the rate strategy intends.
Case Study - Scaling Guest Experience and Revenue Performance Across 270 Properties
Across 270 properties, Haven scaled to a high level of AI-powered automation while maintaining strong guest scores. Support staffing dropped substantially, based on Haven's operational experience scaling with Conduit's platform. One honest trade-off: reaching 90% automation requires a well-structured onboarding process and a thorough knowledge base built before go-live. Properties that invest in that foundation see faster ramp times; those that skip it should plan for a longer period of human-AI handoff before automation rates stabilize at scale.
Related Reading
- Digital Concierge Software
- Best Hotel Channel Manager Software
- Hospitality Chatbot
- Hotel Distribution Management
- Hospitality Conferences
- Best Revenue Management Software For Hotels
- Siteminder Competitors
- Canary Technologies Competitors
- Cloudbeds Alternatives
Next steps
If your RevPAR dropped last quarter and the weekly report surfaced it three weeks after the booking window closed, the path forward starts with removing the lag between the demand signal and the operational response. Start with our AI for hospitality.
ADR and RevPAR are structurally incapable of diagnosing their own deterioration, because the causes (booking window compression, channel mix drift, slow inquiry response) resolve or compound before the numbers appear in any report. That means the metric dashboard cannot be your early-warning system. Guest communication speed is a direct pricing and occupancy input, not a support function, meaning the infrastructure governing response time is the same infrastructure that determines whether your rate strategy actually holds. Together, they point to a single corrective action: closing the coordination lag at the operational layer, before the booking window expires.
Start with Conduit at conduit.ai. From there, you can see how AI Agents trained on your existing SOPs and FAQs begin delivering automated guest replies within days, across every channel and property, including the late-night inquiry surges when manual teams are thinnest, and how the Inbox layer gives your operations team a single surface to monitor every conversation the agent is handling in real time, so the occupancy signals buried in guest message patterns are visible before they register as a RevPAR dip in next week's report.
Frequently Asked Questions
Can RevPAR ever be higher than ADR?
No, RevPAR cannot exceed ADR. Because RevPAR is calculated by multiplying ADR by an occupancy rate that is always below 100%, RevPAR will always be equal to or lower than ADR. For example, an ADR of $200 at 75% occupancy produces a RevPAR of $150, not $200.
Is RevPAR the same thing as ADR?
No, they measure fundamentally different things. ADR measures the average rate collected only on rooms that actually sold, while RevPAR divides total room revenue across every available room, occupied or not. A property can post a record ADR while its RevPAR quietly falls if occupancy is declining at the same time.
How does occupancy rate connect to the RevPAR formula?
Occupancy rate is the direct link between ADR and RevPAR. The second RevPAR formula, RevPAR = ADR multiplied by occupancy rate, makes this explicit: if ADR holds steady at $200 but occupancy drops from 75% to 60%, RevPAR falls from $150 to $120, a 20% revenue loss that never appears in the ADR report. That is why revenue managers prefer this version of the formula for diagnosing performance rather than just reporting it.
When should I focus on ADR versus RevPAR to make a pricing decision?
Use ADR when the question is specifically about pricing effectiveness, channel mix, rate segmentation, or whether your rates reflect genuine demand. Use RevPAR when the question is about capacity efficiency, benchmarking against a competitive set, or whether a rate strategy is actually translating into total room revenue. The most diagnostic signal comes from reading them together: a rising ADR alongside a falling RevPAR is a clear warning that occupancy erosion is quietly outpacing rate gains.
Why can a hotel show a healthy ADR for weeks before anyone notices a revenue problem?
Because ADR excludes unsold rooms entirely, occupancy erosion is invisible in the ADR line until it becomes severe enough to show up in total revenue figures. The post notes that the average gap between performance events and management reporting in hospitality runs days to weeks, meaning the booking window to correct a negative trend has often already closed by the time it surfaces on a weekly dashboard.
Stay in the loop
Get the latest on AI automation, product updates, and customer stories.


