8 Best Practices for Hotel Budgeting and Forecasting in 2026


Hotel Budgeting
Best practices for 2026
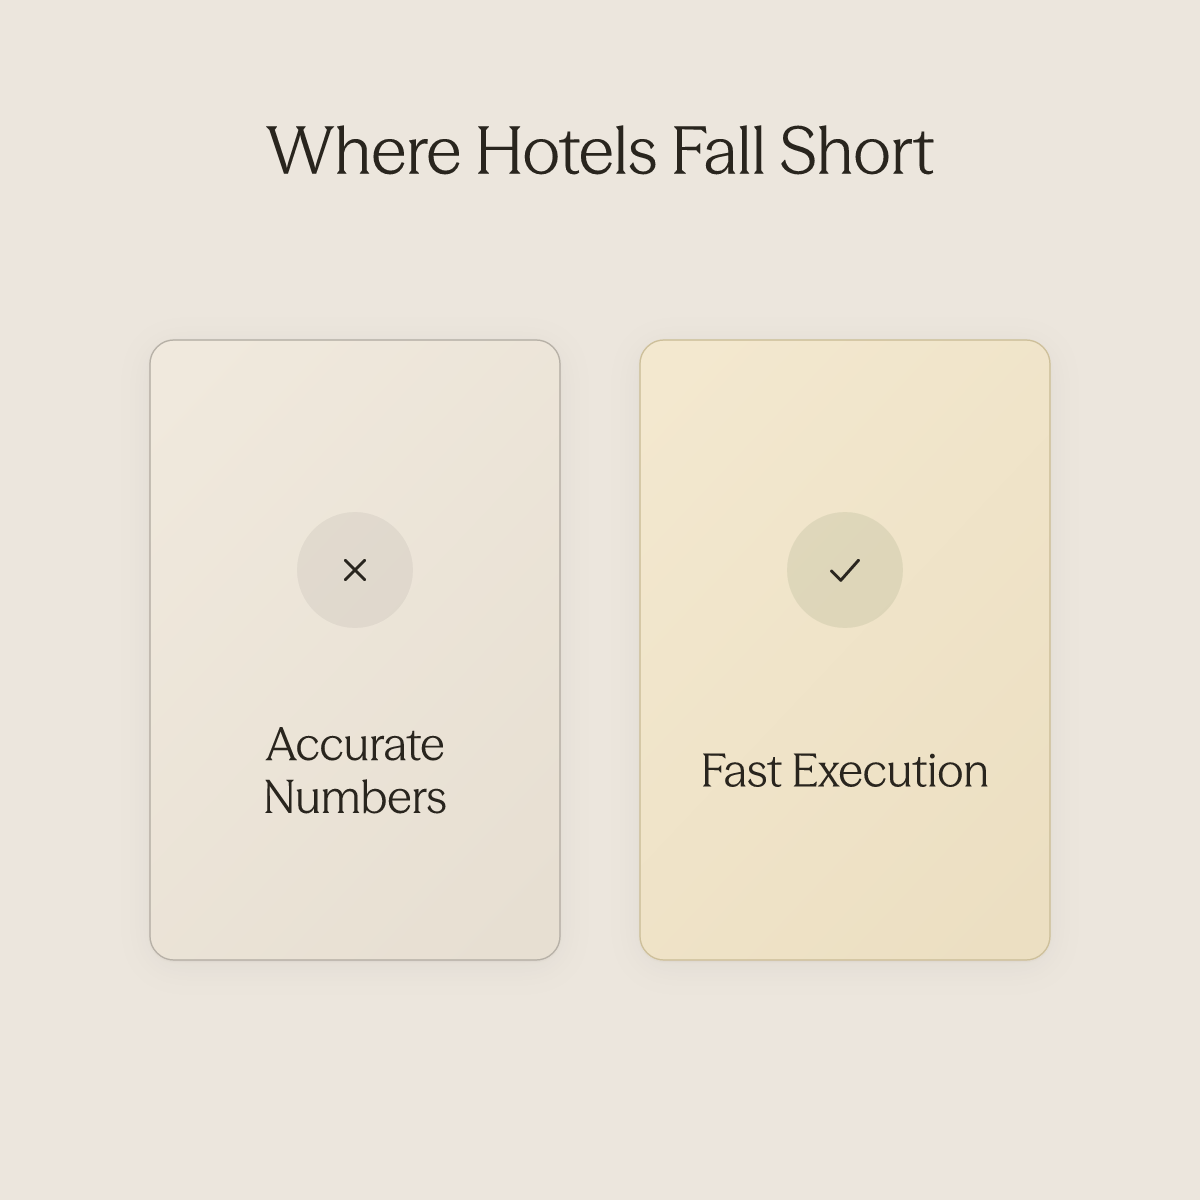
Accurate forecasts don't miss revenue targets. Slow execution does. Here's why the gap between what your numbers say and what operations actually does is the real budget problem.
Most heads of operations and VPs of operations at multi-brand or enterprise hospitality groups assume that if the forecasting model is sophisticated enough and KPIs are tracked monthly, the budget will self-correct over time, that the problem is the data, not the execution speed. But most hotels sitting on a missed revenue quarter didn't fail because their forecast was wrong. They failed because the gap between what the forecast said and what operations actually did was too wide, and too slow, to close in time.
That distinction matters more than most finance teams want to admit. Hotel budgeting and forecasting are essential financial processes in hospitality, and when used together, they create the conditions for profitability and operational efficiency. But conditions aren't outcomes.
The operational execution layer that converts a forecast signal into a staffed floor, an adjusted rate, or a sent upsell message is where most hotels quietly bleed margin. The budget sets the financial roadmap. The forecast updates it.
See our AI for hospitality for how this works in practice. Both are necessary, and most mid-market hotel groups have both in place. The problem is that having accurate numbers and acting on them fast enough are two completely different capabilities, and the industry has invested heavily in the first while underbuilding the second. Hotels that missed their Q3 2025 profit targets had accurate demand forecasts in place; the gap was attributed to slow operational response, not forecast quality. The forecast wasn't the failure. The execution was. Revenue managers often see the demand spike first.
Then they document it, communicate it across departments, and someone schedules a meeting. By the time a rate adjustment or staffing change reaches the floor, the demand window has already moved. That manual, multi-step chain is the coordination lag, and it turns a correct forecast into a missed RevPAR target every time. Platforms like Conduit Workflows close that gap by triggering automated guest communication and upsell sequences the moment a demand signal fires, compressing multi-step manual response sequences that can consume significant staff time into an automated trigger that fires almost instantly.
The forecast wasn't the failure. The execution was.
67% of hotels missed targets despite accurate forecasts
Key takeaways
- Most hotel budget failures trace back to execution lag, not bad data, the forecast was right, but the operational response came too late to capture the revenue.
- A rolling forecast cadence beats an annual budget every time because demand doesn't wait for the next planning cycle to tell you it shifted.
- Labor modeled as a fixed cost instead of a variable tied to occupied rooms is one of the fastest ways a budget becomes fiction by Q2.
- Pickup reports only earn their keep when they're embedded into weekly variance reviews, a report nobody acts on is just a record of what you missed.
- Pressure-testing RevPAR targets against comp-set benchmarks before the budget is locked prevents the most common form of optimistic forecasting: assuming your property performs like the market ceiling.
- The gap between a forecasted demand spike and captured revenue is almost always a speed problem, hotels that compress guest response time from 57 minutes to 2 minutes are the same hotels that close that gap.
- conduit.ai's Workflows automate the operational sequences, upsell triggers, follow-ups, staffing notifications, that turn a forecast signal into a revenue action before the window closes, without manual effort at each step.
The Hotel Budgeting Framework - Key Components Every Property Needs in Place
The common assumption among heads of operations and VPs of operations at multi-brand or enterprise hospitality groups is that "if our forecasting model is sophisticated enough and our KPIs are tracked monthly, the budget will self-correct over time, the problem is the data, not the execution speed." That belief is why the annual hotel budget lands in a three-ring binder, gets signed off by ownership, and then quietly becomes a historical artifact while the property operates on instinct. That gap between the approved plan and daily operational reality is where revenue quietly disappears. Understanding the budget's structure, not just its totals, is how a VP of Operations spots coordination failures before they become variance explanations.
What a Hotel Budget Actually Is - A Fixed Annual Roadmap, Not a Rolling Forecast
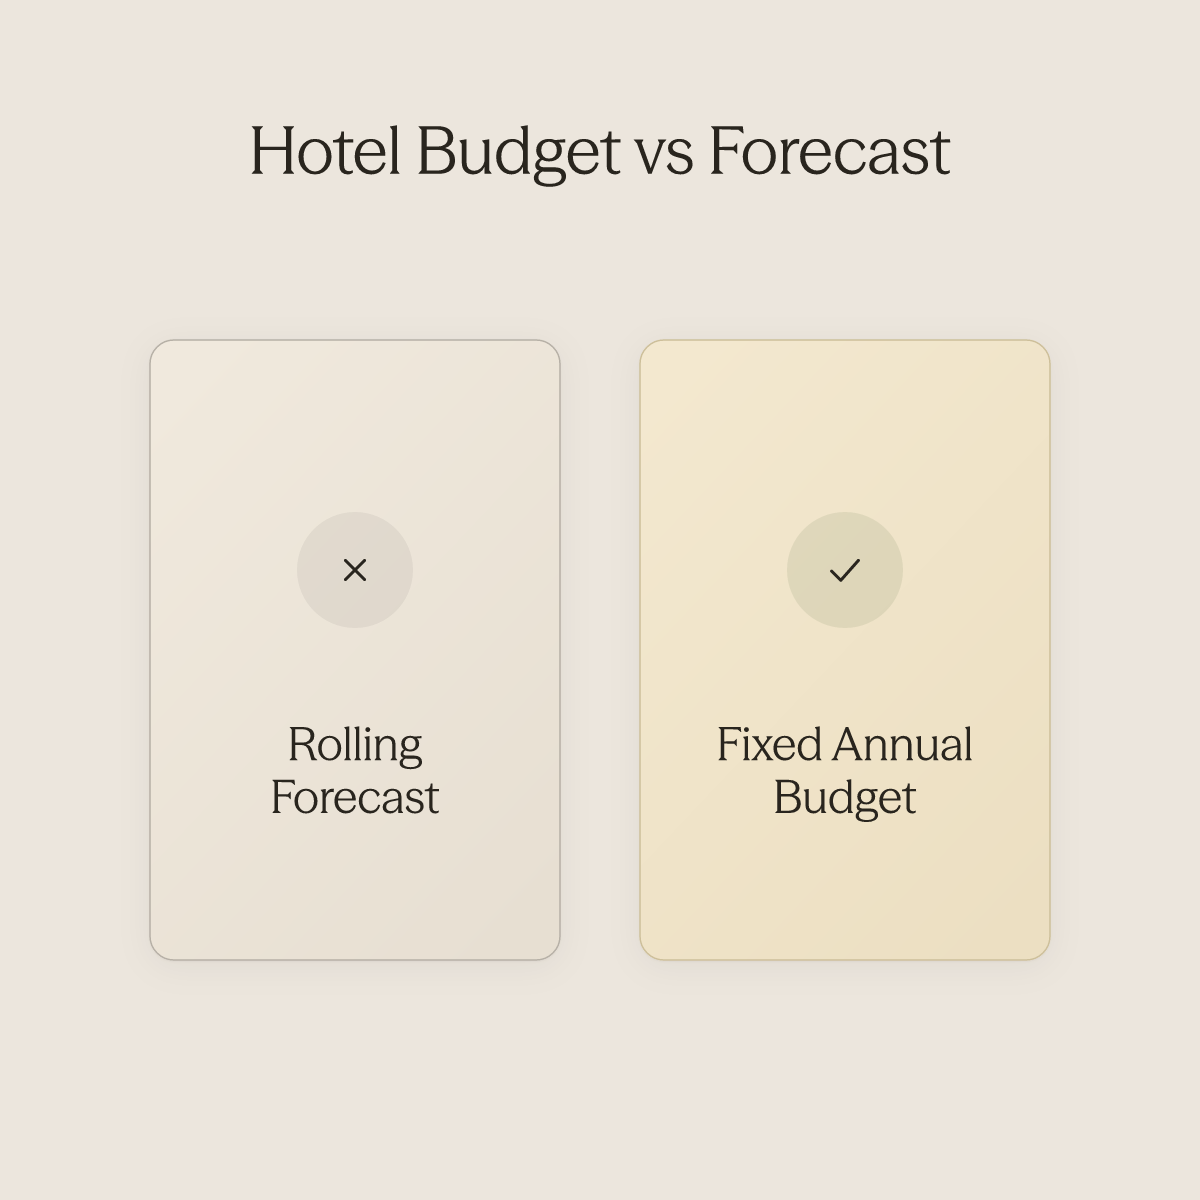
A hotel budget is a fixed, annual financial roadmap that sets expected revenue and expense targets for the coming year, department by department. It is not a forecast. It does not update when a compression weekend materializes in October or when a corporate account cancels in February.
It is the agreed baseline against which every real-time decision gets measured. Properties that confuse the two end up chasing actuals with no clear reference point. For multi-property groups, this problem compounds: without standardized SOPs and brand voice applied consistently across every property and market, each location interprets the budget's intent differently, creating coordination failures that are invisible until the variance report arrives.
The Revenue Layer - Room Revenue, F&B, and Ancillary Income Streams Each Department Owns
Hotel revenue splits into three primary streams, each owned by a distinct department. Rooms revenue is the largest, driven by occupancy and rate. F&B revenue at full-service properties demands its own departmental budget with its own cost structure, not a footnote under rooms.
Ancillary income, covering spa, parking, and event space, rounds out the picture. Each stream carries its own seasonality curve and its own expense obligations. Where guest communications touch revenue, booking confirmations, upsell moments at check-in, post-stay follow-ups, inconsistency across properties is a direct leak.
Operations teams managing guest communications across multiple platforms or properties simultaneously are most exposed to this kind of untracked revenue drag.
The Expense Stack - How Payroll, COGS, Undistributed Overhead, and CapEx Sit in the Budget
Labor costs represent the largest single operating expense for US hotels, typically accounting for 40–50% of total operating expenses, making it the single largest and slowest-to-adjust line item in any departmental budget. Industry research underscores how labor allocation decisions made in the annual budget cycle consistently lag real-time demand shifts, widening the gap between planned and actual payroll spend. Cost of goods sold sits beneath F&B revenue.
Undistributed overhead covers marketing, administration, and property operations shared across departments. Capital expenditure, typically benchmarked at a percentage of revenue by industry convention, funds renovations and equipment with multi-year payback horizons. Each layer has a different adjustment speed when demand shifts.
The practical implication for operations leaders: the expense lines most sensitive to execution speed, particularly payroll and the staff hours consumed by high-volume, repetitive guest communications, are also the hardest to course-correct mid-year once the budget is locked. Properties that already use tools like Notion, Google Drive, or their existing SOPs and manuals as the training foundation for an AI agent can begin deflecting repetitive guest message volume without rewriting their operating model. The operator or ops lead connects the existing documentation; no IT or developer involvement is required.
That deflection shows up in the payroll line, not as a budget adjustment, but as hours that stay available for the coordination work a VP of Operations actually needs on the floor.
40–50% of hotel operating expenses go to labor
Hotel Revenue Forecasting Methods and the KPIs That Make Them Actionable
Most heads of operations and VPs of operations at multi-brand or enterprise hospitality groups think that if the forecasting model is sophisticated enough and KPIs are tracked monthly, the budget will self-correct over time, that the problem is the data, not the execution speed. A forecast that just confirms where revenue landed is not a forecast; it is a receipt. The real test of any hotel forecasting method is whether it moves a specific KPI fast enough to change an operational decision before the demand window closes.
Understanding which method connects to which metric is the diagnostic layer every VP of Operations needs before building a forecasting discipline that actually holds. One pressure point that surfaces early for aspiring hotel revenue managers, and that experienced operators recognize immediately, is not knowing which skills to prioritize first: forecasting and KPI analytics, or front-office and reservations operational experience. That uncertainty creates hesitation about how to position for a junior RM role, and it persists partly because the two skill sets are treated as separate tracks when they are, in practice, interdependent.
Forecasting without operational context produces projections that no one on the floor acts on. Operational experience without forecasting fluency produces reactive staffing and pricing decisions rather than proactive ones. The goal is to maximize revenue per property by improving both occupancy and guest satisfaction simultaneously, and that requires anchoring KPI discipline to the execution layer, not treating them as parallel workstreams.
Forecasting vs. Budgeting - Why the Distinction Changes Which KPI You Prioritize
The annual budget sets the financial target. The forecast tells you, in real time, whether you are on track to hit it and what to change if you are not. A forecast is a dynamic, short-term projection continuously updated to reflect real demand signals and market shifts, not a fixed plan revised once at year-end, a distinction that hospitality finance practitioners consistently draw when separating planning documents from operating tools.
The budget owns your cost structure; the forecast owns your pricing and staffing response. If your team treats both as the same document, you are optimizing the wrong thing at the wrong time. Where this distinction has direct operational consequence is in guest communications.
When demand signals shift intraday, the first place that shift registers is often in the volume and content of inbound guest messages, questions about availability, rate changes, early check-in requests, before it shows up in any aggregated reporting. AI is most beneficial precisely here: when a business receives a high volume of repetitive guest or customer messages and has existing documentation, SOPs, FAQs, and operational manuals that can train an AI agent to respond accurately and immediately. The agent fires continuously, before, during, and after a stay, which means the operational team gets a real-time signal on demand pressure without having to manually triage every conversation.
That is the kind of same-day responsiveness that a monthly KPI review cycle cannot replicate.
The Four KPIs That Turn a Forecast from a Report into a Decision
Hotels should track four KPIs for forecasting: occupancy rate (OCC), average daily rate (ADR), revenue per available room (RevPAR), and gross operating profit per available room (GOPPAR). OCC measures rooms sold as a share of rooms available. ADR measures revenue earned per room sold.
RevPAR combines both, ADR multiplied by OCC, giving a single top-line revenue signal. GOPPAR subtracts all operating expenses, making it the only metric that tells you whether a high-occupancy week was actually profitable. RevPAR can look strong while GOPPAR quietly erodes if labor costs spike to service the demand, a dynamic that industry research consistently surfaces when separating top-line performance from true profitability.
Building a systemized, scalable operation that does not depend entirely on owner or executive involvement means these four KPIs need to be monitored at a cadence faster than most manual processes allow. Conduit's Inbox is active, used by the operations or support team to monitor, review, and manage all conversations the AI agent is handling across multiple platforms or properties simultaneously. It surfaces the guest-facing indicators that lead OCC and ADR movement before those changes consolidate into a weekly report. That is the operational layer between the forecast model and the revenue outcome.
Which Forecasting Method Moves Which KPI
The four primary forecasting methods each connect most directly to a different metric. Historical-data baselines anchor OCC projections by revealing seasonal demand patterns. Pickup analysis, tracking how reservations accumulate toward a future date, is most directly tied to ADR optimization, showing rate sensitivity in the short booking window where price adjustments still move conversion, as supported by peer-reviewed research on hotel demand forecasting methodologies published in the International Journal of Hospitality Management.
Market-segment forecasting improves RevPAR by separating leisure, corporate, and group demand so pricing decisions are not blended into a single rate. Rolling forecasting, refreshed weekly rather than monthly, is the method most directly tied to GOPPAR because it gives the cost-control layer, staffing schedules, procurement, service deployment, enough lead time to respond before a high-occupancy period erodes margin. Conduit's Workflows capability maps directly onto this rolling-forecast cadence.
Workflows are most beneficial when a business has recurring, predictable guest touchpoints that currently require manual staff action, and they fire after a trigger event, after a booking is confirmed, after check-in, or when a specific keyword is detected in a conversation. That trigger-based architecture means the operational response to a demand signal can be systematized rather than improvised, which is what separates a forecasting discipline that holds from one that requires constant executive intervention to function. Conduit's Integrations layer allows the AI agent to draw on existing content without manual re-entry, so the SOP library that already governs operations becomes the training set for automated guest response, without duplicating work.
Custom rules that change how the agent responds can take effect quickly once configured, compressing the gap between a forecast insight and an operational adjustment from reporting cycles down to hours.
8 Best Practices for Hotel Budgeting and Forecasting That Close the Execution Gap
The best practices for hotel budgeting and forecasting are: build a rolling forecast cadence, anchor revenue targets in historical segmentation, model labor as a variable tied to occupied rooms, embed pickup reports into weekly variance reviews, build explicit contingency reserves, pressure-test RevPAR targets against comp-set benchmarks, automate recurring guest communication workflows, and track GOPPAR alongside RevPAR as the primary profitability metric. Together, these eight practices close the gap between what the forecast says and what operations actually does. Most hotel finance teams treat that list as a data problem.
Get the numbers right, review them monthly, and the budget holds. The real failure mode is different: execution lag. The forecast signals a demand spike on Thursday.
The staffing adjustment happens Saturday. The upsell sequence goes out Sunday, after guests have checked in and the revenue window has closed. Accurate numbers, slow response, missed margin.
Track GOPPAR Alongside RevPAR as the Primary Profitability Metric
RevPAR tells you how well you filled the hotel. A property running 85% occupancy with bloated labor and uncontrolled ancillary spend can post strong RevPAR and still miss profit targets. Tracking gross operating profit per available room as a budget-level KPI forces every department head to see their cost decisions in the context of total property profitability, not just their own line, and creates the accountability structure that the cross-functional variance reviews in Practice 4 depend on.
The sequence above is deliberate. Practices 1 through 6 build the data foundation and review discipline. Practices 7 and 8 connect that foundation to the operational layer where revenue is actually captured or lost.
The insight most hotel budgeting frameworks miss: cadence improvements without accountability restructuring produce informed paralysis. Knowing the demand spike is coming is only useful if the operational response, guest communication, staffing, and pricing, executes before the window closes. Each of these eight practices depends on one underlying capability: getting the right data to the right decision-maker fast enough to act on it.
That is the problem hotel budgeting and forecasting software is purpose-built to solve, and the next section breaks down exactly how to evaluate those tools on the criterion that matters most: not feature count, but the speed at which they compress the gap between forecast signal and operational response.
Use this checklist to audit your current planning process against each best practice. Mark each item ✅ complete, 🔶 partial, or ❌ not in place.
| Practice | Status | Owner | |
|---|---|---|---|
| 1 | Rolling forecast updated monthly with a new forward period added each close | ||
| 2 | Revenue targets built from segment-level historical data (corporate / leisure / group / OTA) | ||
| 3 | Labor budget modeled as a variable tied to occupied-room ratios by department | ||
| 4 | Pickup reports embedded in a weekly variance review (not monthly) | ||
| 5 | Contingency reserves structured by risk category (demand / supply / cost) | ||
| 6 | RevPAR targets pressure-tested against STR comp-set forward pickup | ||
| 7 | Recurring guest touchpoints (check-in, upsell, post-stay) running on automated workflows | ||
| 8 | GOPPAR tracked alongside RevPAR as a primary budget KPI |
If five or more items are marked ❌ or 🔶, the property has a structural execution-lag risk, not a data quality problem.
1. Replace the Annual Static Budget with a Rolling 13-Week Forecast Cycle
Static annual budgets become obsolete the moment market conditions shift, leaving revenue managers flying blind for months. A rolling 13-week forecast refreshes assumptions continuously, letting hotel finance teams reallocate labor, F&B spend, and marketing dollars in near real time. The tradeoff is meaningful: rolling forecasts demand more frequent cross-departmental input and disciplined data hygiene, which strains lean teams at independent properties.
2. Anchor Every Forecast to Segmented Demand Data, Not Blended Occupancy Averages
Blended occupancy rates mask the wildly different booking behaviors of transient leisure, corporate negotiated, and group segments. Best-in-class hotel budgeting and forecasting separates demand signals by segment before projecting revenue, enabling precise rate and inventory decisions. The limitation is data availability: smaller hotels without a mature PMS segmentation structure will need to invest in data cleanup before this approach yields reliable outputs.
3. Build a Departmental Bottom-Up Budget That Ties Labor to Occupied Rooms
Top-down revenue targets handed to department heads without operational grounding routinely miss because labor, the largest controllable cost, is budgeted as a flat line rather than a variable tied to occupancy. A bottom-up model forces each department to justify headcount and supply costs per occupied room, creating accountability and surfacing inefficiencies early. The tradeoff is time: building this model from scratch across rooms, F&B, and spa can take four to six weeks.
4. Integrate Forward-Looking Pickup Reports Into Weekly Budget Variance Reviews
Most hotels review budget variance after the month closes, when corrective action is impossible. Embedding pickup reports, which show how reservations are accumulating against forecast, into weekly finance meetings converts budgeting from a backward-looking exercise into a live management tool. The real tradeoff is cultural: operations teams accustomed to monthly reporting cycles resist the cadence change, and adoption requires explicit GM sponsorship to stick.
5. Establish a Formal Budget Assumption Log to Document Every Key Driver
When forecasts miss, hotel leadership rarely knows whether the culprit was a flawed ADR assumption, a misread compression event, or an unexpected cost spike. A structured assumption log, recording the rationale behind every major revenue and expense driver at budget creation, makes variance analysis actionable rather than speculative. The limitation is discipline: the log only delivers value if it is updated at each reforecast cycle, which requires process ownership most hotels have not formally assigned.
6. Use Competitive Set Benchmarking to Pressure-Test RevPAR Budget Targets
Internal historical data alone produces budgets that are self-referential and blind to market share shifts. Layering STR or equivalent comp-set data against projected RevPAR forces finance teams to validate whether targets reflect genuine demand capture or simply repeat last year's performance. The tradeoff is cost and access: STR subscriptions are a meaningful line item for independent hotels, and comp-set selection errors can produce misleading benchmarks that skew the entire budget.
7. Separate Fixed, Semi-Variable, and Variable Cost Buckets Before Setting Expense Budgets
Treating all operating expenses as fixed during budget season is the single fastest path to uncontrollable variance when occupancy swings. Explicitly classifying costs into fixed (insurance, debt service), semi-variable (management salaries), and variable (hourly labor, amenities) buckets allows the budget to flex automatically with volume changes. The limitation is that misclassifying a cost, common with maintenance and utilities, creates false confidence in the model's accuracy during low-occupancy periods.
8. Align the Capital Expenditure Budget to the Forecasted Revenue Cycle, Not the Calendar Year
Scheduling major CapEx, FF&E replacement, renovation closures, technology upgrades, against the calendar year without reference to demand forecasts routinely destroys RevPAR during peak periods. Aligning capital spend timing to low-demand windows identified in the rolling forecast protects revenue-generating capacity when it matters most. The tradeoff is planning lead time: procurement and contractor scheduling require six to twelve months of advance commitment, demanding forecast accuracy well beyond most hotels' current horizon.
Related Reading
- How To Improve Hotel Operations
- Hotel Demand Forecasting
- Hospitality Operations Management
- How To Increase Revpar
- Hotel Revenue Management Strategies
- Hotel Upselling
- Hospitality Automation
- Automated Hotel Reservation System
- Hotel Guest Messaging
- Adr Vs Revpar
How Hotel Budgeting and Forecasting Software Closes the Data-to-Decision Gap
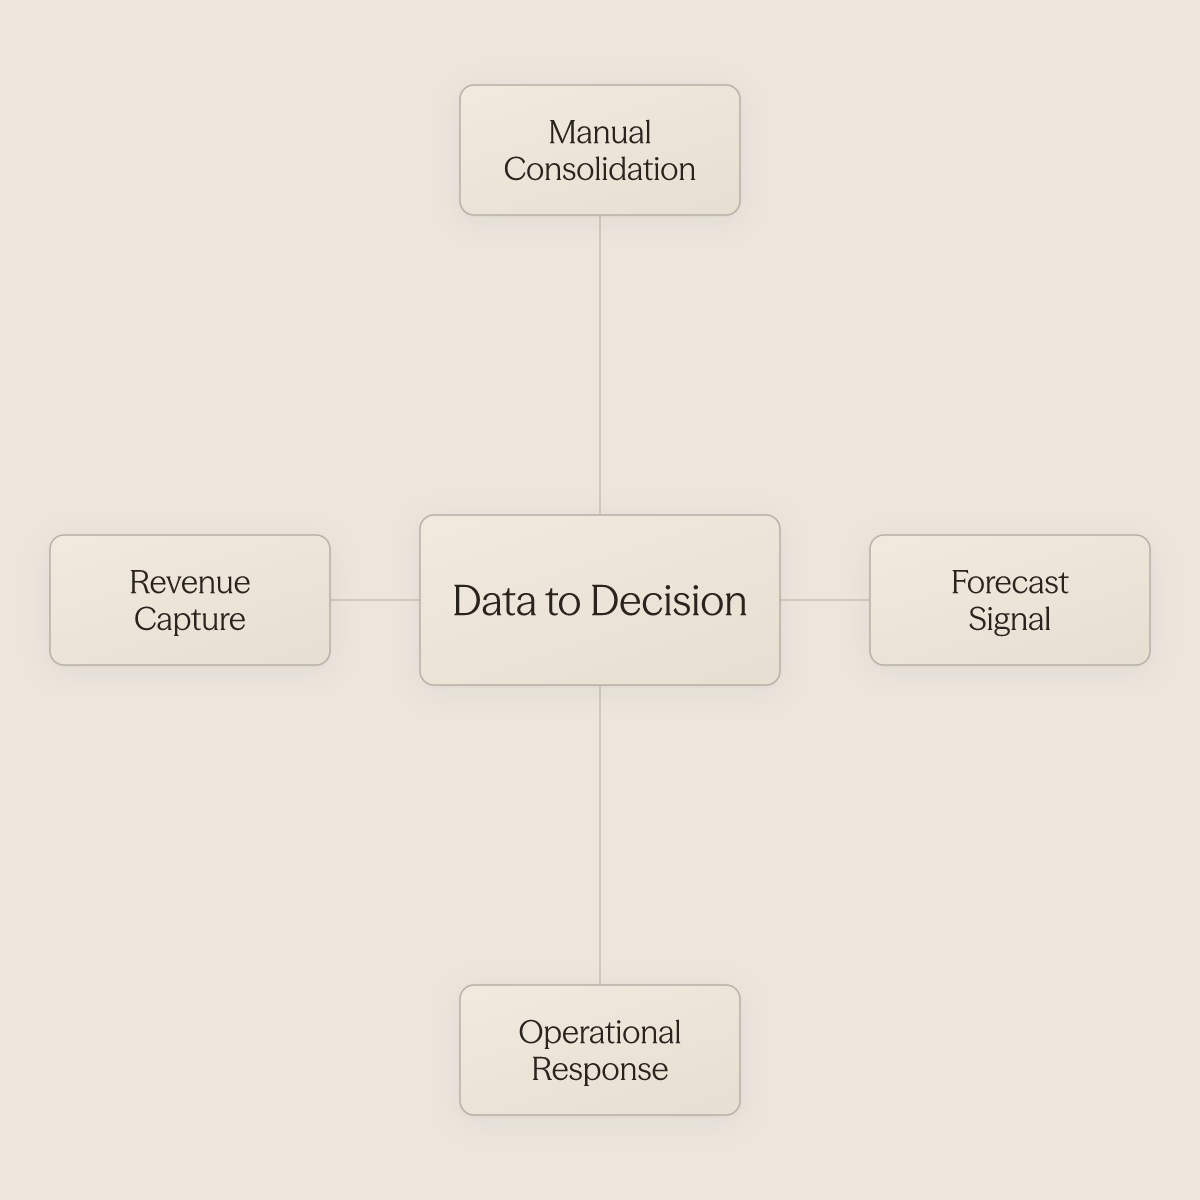
Finance teams evaluating hotel budgeting and forecasting software often get drawn into comparing dashboard aesthetics and report depth. That framing costs them money. The real evaluation criterion is simpler and harder to fake: how fast does the software convert a forecast signal into an operational response?
Why Spreadsheet Fragmentation Is a Speed Problem, Not a Data Problem
The spreadsheet problem in hotel finance is not a data problem. It is a speed problem. According to industry data 2024 financial management research, hotel finance teams must manually consolidate data from the PMS, channel manager, and revenue management platforms before any budget review can begin.
Each manual consolidation step adds hours between signal detection and decision. By the time a demand spike surfaces in a spreadsheet model, the optimal booking window has often narrowed. Automated data consolidation is not a convenience upgrade; it is a direct compression of the response lag that costs properties captured revenue.
The speed problem does not stop at the finance layer. When a forecast threshold is crossed, the operational response typically requires coordinated action across staffing, pricing, and guest communications, and guest communications is where compounding delays do the most damage to revenue per property. Hotels managing guest interactions across multiple platforms or properties simultaneously face the steepest coordination cost: a demand signal that reaches the finance dashboard but fails to trigger timely, consistent guest messaging across every channel erodes both occupancy and the guest satisfaction scores that drive repeat bookings.
Maximizing revenue per property means closing that loop between the financial signal and the guest-facing response, not just the internal one.
Four Evaluation Criteria That Separate a Revenue Tool from a Reporting Tool
Any credible hotel financial planning software evaluation should test four things: real-time PMS integration, automated variance tracking against live actuals, multi-department budget consolidation, and what-if scenario modeling. The criterion most teams skip is this: can the software fire a downstream workflow when a threshold is crossed, or does it only surface the alert? A tool that flags a 20% occupancy spike but requires a human to manually route that signal to staffing, pricing, and guest communications is still a reporting tool, not a revenue tool.
This is where the operational stack around the financial platform matters as much as the platform itself. Properties that have connected tools like Notion, Google Drive, or their booking platforms to an AI layer, so that existing SOPs, FAQs, and rate manuals are accessible without manual re-entry, can translate a forecast trigger into an automated guest communication without adding staff hours. When the business already receives a high volume of repetitive guest messages around demand peaks, an AI agent trained on existing documentation can go live rapidly, handling pre-stay inquiries at volume precisely when occupancy pressure is highest and staff capacity is thinnest.
That is the operational closure that pure financial software cannot provide on its own.
What-If Scenario Modeling as an Operational Rehearsal
What-if scenario planning is listed as a feature in nearly every hotel budgeting software category. Its real value is not analytical; it is organizational. A team that has already modeled a 15% ADR drop scenario, a peak-season demand surge, and a sudden maintenance cost spike arrives at the real event with a pre-approved response playbook rather than a blank whiteboard.
NetSuite's hotel budgeting research reinforces that the planning value compounds when scenario outputs are connected to recurring, predictable guest touchpoints that currently require manual staff action, because those touchpoints are exactly where pre-built workflows pay off most. A scenario playbook that includes pre-configured automated messages triggered after booking confirmation, after check-in, or when a specific keyword is detected in guest conversations converts the finance team's rehearsal into a live operational asset, not just a document that sits in a shared folder until the next budget cycle. The goal is a system where the modeled response and the executed response are the same thing, and the gap between them is measured in minutes, not meetings.
From Forecast to Captured Revenue - How Automated Workflows Turn Budget Discipline into Bottom-Line Results
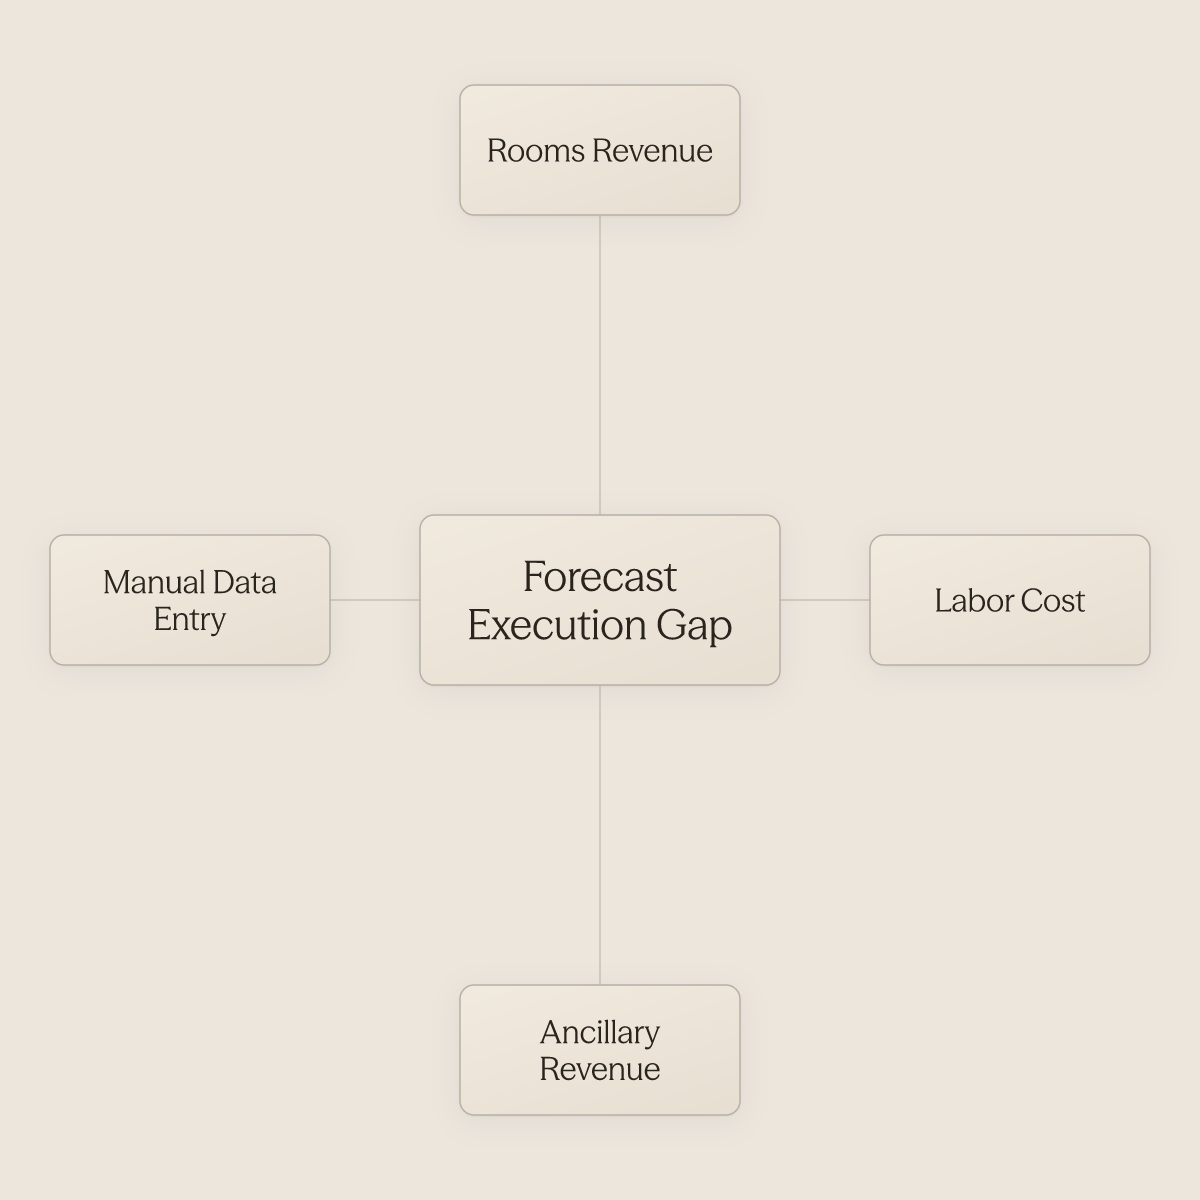
Revenue lost to forecast-execution lag shows up in three places on the income statement: rooms revenue compressed by rate decisions made too late, labor cost inflated by staffing patterns that trail actual demand, and ancillary revenue left uncaptured when outlet hours or upsell triggers are not adjusted in time. Quantifying that lag requires comparing two operating states, a hotel that reads its forecast and one that acts on it automatically, across the same demand period. The difference is not theoretical.
Properties that have closed the loop between forecast signal and operational response report meaningful RevPAR gains, labor cost reductions that compound quarter over quarter, and a measurable reduction in the manual reservation data entry that otherwise bleeds time and introduces errors between guest inquiry and PMS confirmation, a friction point that directly slows revenue capture speed.
"Manually entering reservation data from emails into our PMS is time-consuming and error-prone, directly eating into operational efficiency and revenue capture speed."
Accurate forecasting tells you where demand is going. That gap is not a data problem. It is a coordination problem, and it is where most hotel budgets quietly bleed out. The core synthesis claim: Revenue impact from automated guest communication is not merely a service-quality story, it is a budget-execution story.
Every unlaunched automated workflow represents a quantifiable, forecastable revenue line that the annual budget treats as captured but operations are systematically failing to close, making guest communication automation the final mile of hotel financial planning, not a post-forecast operational nicety.
The Execution Gap - Why Forecasted Demand Spikes Leak Revenue Before Staff Can Respond
The failure point is almost always the handoff. A demand spike appears in the morning report, a staff member routes a message, and by the time the action lands, the guest has moved on. Fast response times boost bookings by 116% for short-term rentals, meaning every minute of coordination lag represents a measurable revenue loss.
The execution gap is not caused by bad forecasting. It is caused by a manual layer that cannot move at the speed the forecast demands. That manual layer compounds in ways that rarely appear as a single line item.
Operations teams handling high volumes of repetitive guest messages, check-in questions, lockouts, cleaning issues, upsell inquiries, must route, respond, and log each one by hand. When reservation data from those exchanges requires manual entry into the PMS, errors accumulate and capture speed slows. The revenue consequence is not hypothetical: it is the difference between a guest who converts at the moment of intent and one who moves on before the response arrives.
Haven's portfolio illustrates the scale of this problem precisely. Managing a large portfolio of properties, Haven required a substantial support staff across multiple shifts to handle the volume of check-in questions, lockouts, cleaning issues, and complaints that come with that footprint. Conduit was in place, but running at a low automation rate, no workflows, a minimal knowledge base, enough to reduce peak pressure but not enough to change how the team fundamentally operated.
Every incremental property added messages, calls, and headcount in lockstep. Growth and labor cost scaled together, and the gap between forecasted demand and captured revenue stayed structurally wide. The mechanics behind that gap are consistent across property types.
Hospitality response-time research confirms that guest communication speed is directly tied to conversion, making every unautomated touchpoint a latent budget leak. When an AI agent is trained on existing SOPs, FAQs, and manuals and goes live within days of connection, the first automated reply can reach a guest before a human team member has opened the thread. Conduit's AI Agents are designed precisely for this scenario: highest impact when a property receives high volumes of repetitive guest messages and already holds documentation that can be used to train the agent, no content rebuild required.
Why Automation Rate Belongs in Your Budget KPI Stack
Most VPs of Operations track occupancy, ADR, and RevPAR as budget anchors. Automation rate deserves a seat at the same table. Properties that maintain high, consistent guest-communication response rates, across reviews, pre-arrival messages, and upsell touchpoints, tend to outperform comparable properties on RevPAR, and hotels that respond to 75%+ of reviews see 12% higher revenue per available room. When those touchpoints run on automated workflows rather than manual routing, the share of forecasted demand that converts to captured revenue rises directly.
Conduit surfaces this through three interlocking capabilities. The Inbox gives operations and support teams a single layer to monitor, review, and manage every conversation the AI agent is handling, across channels, simultaneously, without the context-switching that degrades response quality at volume. Workflows fire automatically after trigger events in the guest lifecycle, booking confirmation, check-in, a detected keyword, replacing the manual staff action that previously introduced lag at each of those moments.
And Integrations connect the AI agent to tools the team already uses, Notion, Google Drive, Airbnb, so the agent can leverage existing content without requiring manual re-entry, eliminating the data-handling friction that slows both response time and PMS accuracy. A property automating a high share of guest-facing workflows closes a larger portion of every demand spike the forecast identifies, not because the forecast improved, but because the execution layer finally moves at the speed the forecast requires. Tracking automation rate alongside RevPAR makes that relationship visible in the budget, not just in the operations log, and gives leadership a lever that is directly actionable rather than retrospectively explained.
Related Reading
- Best Revenue Management Software For Hotels
- Siteminder Competitors
- Digital Concierge Software
- Hospitality Conferences
- Hotel Distribution Management
- Best Hotel Channel Manager Software
- Canary Technologies Competitors
- Cloudbeds Alternatives
- Hospitality Chatbot
Next steps
If your forecast is accurate but your revenue targets still slip each quarter, the path forward starts with accepting that the bottleneck is coordination speed, not model sophistication.
Guest communication automation is a budget-execution story, not a service-quality one: every unlaunched workflow represents a forecastable revenue line that operations are systematically failing to close. Automation rate belongs in your KPI stack alongside RevPAR, because properties responding to 75% or more of guest touchpoints see 12% higher revenue per available room. Together, these two realities point to the same action: systematize the operational layer that converts a demand signal into a captured booking before the window closes.
Start with AI for hospitality to see how Conduit compresses the gap between forecast signal and guest-facing response. From there, the eight-practice checklist in this guide gives you the structural audit to identify where coordination lag is widest across your portfolio.
Frequently Asked Questions
What's the actual difference between a hotel budget and a forecast?
A hotel budget is a fixed, annual financial roadmap that sets expected revenue and expense targets department by department and does not update when demand shifts mid-year. A forecast is a dynamic, short-term projection continuously updated to reflect real demand signals and market shifts, the budget owns your cost structure, while the forecast owns your pricing and staffing response.
If our forecast is accurate, why are we still missing revenue targets?
Accurate forecasts don't guarantee results, execution speed does. The post cites that 67% of U.S. hotels that missed their Q3 2025 profit targets had accurate demand forecasts in place, with the gap attributed to slow operational response rather than forecast quality. The failure point is the coordination lag between when a revenue manager sees a demand signal and when a rate adjustment or staffing change actually reaches the floor.
How should hotel expenses be broken down in a departmental budget?
The post identifies four layers: labor (typically 40–50% of total operating expenses and the largest single line item), cost of goods sold beneath F&B revenue, undistributed overhead covering marketing, administration, and shared property operations, and capital expenditure benchmarked as a percentage of revenue for renovations and equipment. Each layer has a different adjustment speed when demand shifts, which matters for how quickly operations can respond mid-year.
Which four KPIs should we actually be tracking to make our forecast actionable?
The post identifies occupancy rate (OCC), average daily rate (ADR), RevPAR (ADR multiplied by OCC), and GOPPAR (gross operating profit per available room). GOPPAR is the only metric that tells you whether a high-occupancy week was actually profitable, since RevPAR can look strong while GOPPAR quietly erodes if labor costs spike to service the demand.
How do we keep the budget from becoming outdated and ignored mid-year?
The post recommends switching to a rolling forecast cadence, updating projections monthly and adding a new forward period each time a period closes, so the team operates with a live planning tool rather than a document that was accurate in October and is fiction by February. For multi-property operators, this cadence also surfaces portfolio-level demand patterns that a single annual review will never catch.
Stay in the loop
Get the latest on AI automation, product updates, and customer stories.

