RevPAR Explained: What It Is and How to Calculate It


What Is RevPAR
Learn how to calculate it, and use it
RevPAR tells you the score, not how the game was played. Here is what the industry's default room metric actually measures, where it goes blind, and why that gap costs operators more than they think.
RevPAR, short for Revenue per Available Room, is the hospitality industry's most widely tracked room-level performance metric. Most hospitality business owners think that if their RevPAR isn't moving, they need to adjust their pricing strategy or their channel mix, those are the two levers they control. But that assumption skips past what RevPAR actually measures, and more importantly, where it stops measuring, and for operators managing lean portfolios, that gap is the difference between diagnosing a revenue problem and missing it entirely. See our AI for hospitality for how this works in practice.
RevPAR (Revenue per Available Room) is a critical hospitality KPI that measures a property's ability to fill its rooms at an average rate across a given period. A 100-room hotel generating $8,000 in room revenue on a single night has a RevPAR of $80, whether 80 rooms were occupied or 100. The denominator is always total available rooms, not just the ones that sold.
 That distinction matters more than most operators realize. The metric captures the relationship between two inputs: how many rooms you sold and at what price. Strong occupancy with a weak rate produces a low RevPAR.
A high rate with too many empty rooms produces the same result. RevPAR surfaces both failure modes in one number, which is exactly why it became the default room-revenue benchmark across the industry. Industry research widely regards RevPAR as the hospitality industry's default room-revenue benchmark because it requires minimal inputs and translates instantly across property types and market sizes.
RevPAR only counts revenue that completed a booking cycle. It has no visibility into the inquiry that went unanswered at 1am, the quote that expired before a follow-up landed, or the guest who booked somewhere else by morning. That lost revenue never enters the calculation.
That distinction matters more than most operators realize. The metric captures the relationship between two inputs: how many rooms you sold and at what price. Strong occupancy with a weak rate produces a low RevPAR.
A high rate with too many empty rooms produces the same result. RevPAR surfaces both failure modes in one number, which is exactly why it became the default room-revenue benchmark across the industry. Industry research widely regards RevPAR as the hospitality industry's default room-revenue benchmark because it requires minimal inputs and translates instantly across property types and market sizes.
RevPAR only counts revenue that completed a booking cycle. It has no visibility into the inquiry that went unanswered at 1am, the quote that expired before a follow-up landed, or the guest who booked somewhere else by morning. That lost revenue never enters the calculation.
Key takeaways
- RevPAR is Revenue per Available Room, it tells you how much room revenue your available inventory generated, nothing more and nothing less.
- Two formulas build the same number: ADR multiplied by occupancy rate, or total room revenue divided by rooms available, and the split between those inputs matters more than the headline figure.
- A rising RevPAR can mask a broken operation: high ADR with cratering occupancy and high occupancy with suppressed rates both produce identical RevPAR scores.
- RevPAR ignores ancillary revenue, distribution costs, and labor, which is why GOPPAR and TRevPAR exist and why profitable operators track all three.
- Inquiry response speed is a revenue variable, not a courtesy one, leads that go unanswered past the first few minutes convert at a fraction of the rate of leads touched immediately.
- The gap between a strong RevPAR and your actual revenue potential is mostly an execution problem, not a pricing problem, and it widens every night your front desk goes dark.
- Conduit's AI-powered guest communication tools keep that gap from compounding by handling booking inquiries around the clock, so the 1am lead doesn't become someone else's confirmed reservation.
How Do You Calculate RevPAR? (Both Formulas, With Examples)
Pick up a STR/CoStar data release and you will find RevPAR printed as a single, tidy number. What you will not find is any indication of how that number was built, or whether the inputs holding it up are healthy. The core diagnostic problem is this: RevPAR's dual-formula construction, ADR × Occupancy, makes it mathematically impossible to diagnose whether a plateau is a pricing failure or a fill-rate failure, because the same flat RevPAR number can be produced by a dozen different ADR/occupancy combinations; operators who treat a stable RevPAR as a stable strategy are actually reading a single output and hallucinating a cause.
For operators trying to diagnose a plateau, knowing which formula to run first is the difference between spotting the real problem and chasing the wrong fix. There is a subtler trap layered on top of this one. A market can post strong RevPAR growth year-over-year and still sit well below the national average in absolute RevPAR terms.
 That gap matters because operators who benchmark only against their own prior performance can mistake momentum for market parity. Raw RevPAR values are genuinely misleading without the right context, and building a business that does not depend entirely on owner-level interpretation of every metric is exactly what separates scalable STR operations from ones that stall. Both formulas below are tools for building that context systematically.
Formula 1 - Total Revenue Divided by Available Rooms
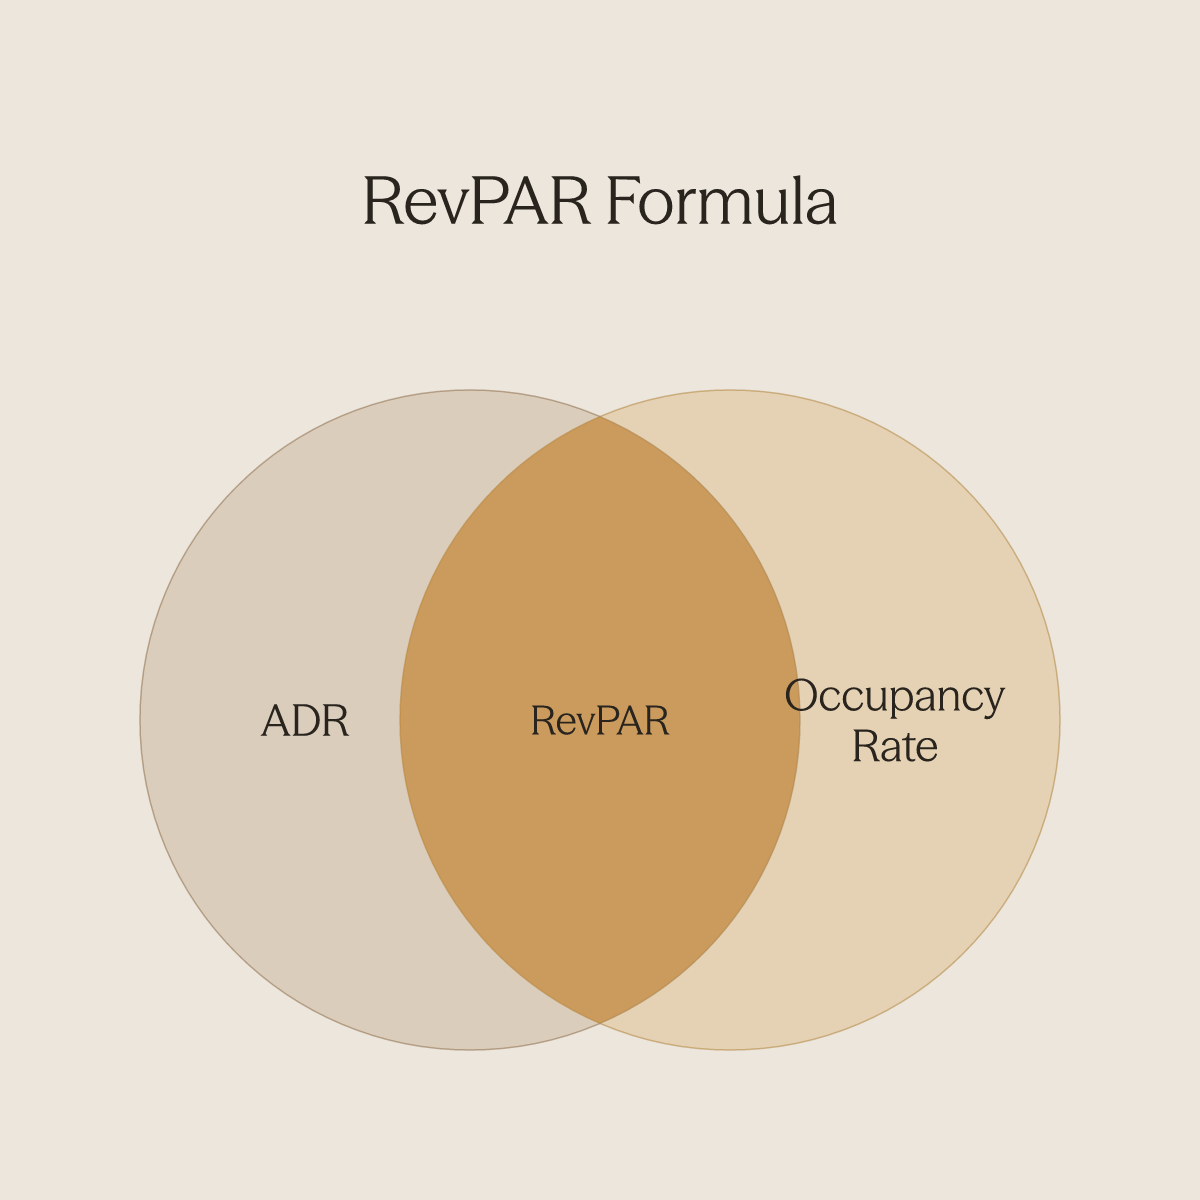
RevPAR = Total Room Revenue / Total Available Rooms. A property collects $8,000 in room revenue across 100 available rooms on a given night; RevPAR is $80. Your property management system almost certainly runs this version automatically, which is exactly why it gets used without much thought. It tells you only what the score was, not how the game was played. A revenue dip looks identical whether it came from a rate problem or a fill-rate problem, and the formula gives you no way to tell them apart.
Formula 2 - ADR Times Occupancy Rate
RevPAR = Average Daily Rate (ADR) × Occupancy Rate. This is the diagnostic version. Take the same 100-room night: if ADR was $160 and occupancy was 50%, RevPAR is $80. If ADR was $100 and occupancy was 80%, RevPAR is also $80. Same score, completely different operational story. The first property has a fill-rate problem; the second has a pricing problem. Formula 2 makes that split visible in one calculation, and it is the split that determines which lever an operator should pull next.
Worked Example - Running Both Formulas on the Same Night
S. 70. 70.
- The outputs match exactly. Formula 2 immediately shows that roughly 37 rooms sat empty that night and that ADR is doing most of the heavy lifting. 70 but your occupancy is 75% rather than 63%, your ADR is actually lagging the benchmark, a pricing problem, not a fill-rate win. That is the kind of diagnosis a single RevPAR headline number will never surface on its own. Operators managing multiple properties face a compounding version of this challenge: they need that two-formula diagnostic running consistently across every unit, not just the one they happen to be watching. Conduit's AI Agents and Workflows are built for exactly that operating reality, most beneficial when the business has recurring, predictable guest touchpoints that currently require manual staff action and when it receives a high volume of repetitive guest or customer messages. By handling guest communications automatically before, during, and after a stay, the platform frees the operations team to focus on revenue diagnostics rather than inbox triage. The goal is a systemized, scalable business that does not depend entirely on owner involvement in every conversation, or every formula check.
Why Does RevPAR Matter: and What a Good RevPAR Number Actually Signals
Watching your RevPAR climb month over month feels like confirmation that the revenue strategy is working. But RevPAR is better understood as a diagnostic lens than a destination metric. The split between ADR and occupancy sitting underneath it tells you far more than the headline figure ever will.
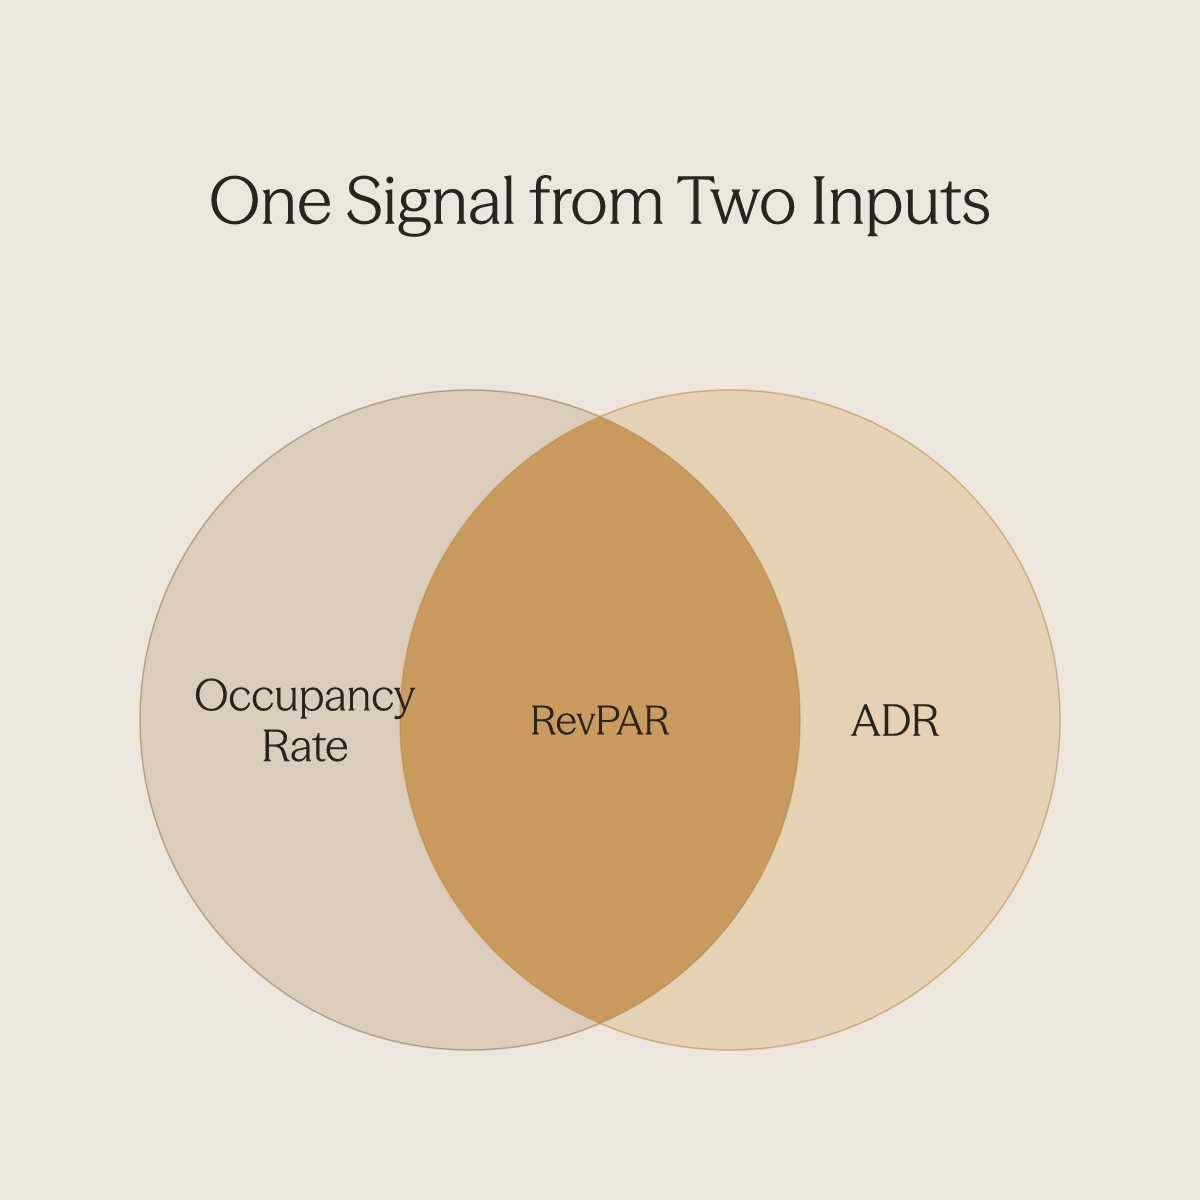
RevPAR Collapses Two Variables into One Signal, and That Is Exactly Its Power
RevPAR matters because it answers a question that neither occupancy nor ADR can answer alone: how effectively are you converting your available room inventory into actual revenue? A property running 95% occupancy sounds impressive until you learn the ADR is $80. A property with a $220 ADR sounds equally strong until occupancy sits at 45%. RevPAR collapses both inputs into one comparable figure, giving operators a single, honest read on room-level revenue performance across dates, seasons, and properties. For operators managing multiple properties simultaneously, that single figure also becomes a cross-portfolio signal, one place to spot which assets are underperforming before the monthly P&L confirms it. Building a systemized, scalable operation that does not depend entirely on owner involvement means the RevPAR read has to be legible to your operations team, not just to you. Ai are designed to close, by centralizing the conversation layer across properties so the operations team has full visibility without the owner being in every thread.
The Two Failure Modes RevPAR Surfaces That Occupancy and ADR Hide Individually
The same RevPAR number can hide opposite problems. High occupancy with a weak ADR means you filled the rooms but priced them too low, leaving margin on the table. High ADR with low occupancy means the rate is strong but demand is not converting, and empty rooms generate zero revenue regardless of what they were listed at. hotel occupancy fell 2.5% year-over-year while ADR rose only 0.4%, two variables moving in opposite directions simultaneously. Watching either metric in isolation that month would have given operators an incomplete, potentially misleading picture of where the real pressure was coming from. What makes this failure mode especially costly at scale is that the diagnostic conversation, the back-and-forth between owner, operations lead, and front-desk staff trying to figure out why conversion is soft, consumes hours that a systemized operation cannot afford to spend reactively. When the operations or support team is already stretched monitoring guest communications across multiple platforms, adding a performance-triage loop on top of it compounds the drag.
Why a Rising RevPAR Can Still Mean Falling Profit - Distribution Costs Explained
Here is the synthesis that most RevPAR discussions never surface explicitly: OTA-driven RevPAR growth is a self-canceling strategy, because the same channel activity that lifts RevPAR above the line simultaneously locks in 15–25% commission costs below it. Because RevPAR does not net out distribution expenses, operators using it as their primary health signal will systematically over-invest in the channel mix that is quietly destroying their NOI, discovering the damage only in quarterly P&L statements, long after the high-commission bookings have checked out. markets: properties in the same metro can show similar RevPAR figures while sitting on dramatically different net operating outcomes depending on their channel mix. The number at the top of the report does not tell you which properties are building equity and which are funding OTA growth at their own expense.
How the RevPAR Index Turns a Raw Number into a Competitive Verdict
The RevPAR Index, also called the Revenue Generation Index (RGI), solves the relativity problem directly. An RGI of 100 means your property is capturing exactly its fair share of RevPAR relative to your defined competitive set. Above 100, you are outperforming the set; below 100, the competitive set is taking share you should be capturing. Tracking RGI alongside raw STR/CoStar benchmarks is what turns a single headline figure into an actionable competitive verdict, and it is the kind of ongoing monitoring that scales cleanly when the operational layer underneath it is already systemized rather than owner-dependent.
The Limitations of RevPAR - What the Number Can't See
RevPAR is useful until the moment you need to know whether your property is actually making money, and that moment arrives faster than most operators expect. The metric captures room revenue per available room but goes silent on everything that happens between a booking and a bank deposit, which means a rising RevPAR can carry genuine financial risk dressed up as good news. The sub-sections below break down exactly where that silence lives and why the layers RevPAR ignores are the same layers where smarter communication execution tends to move the needle most.
A Higher RevPAR Does Not Mean Higher Profit
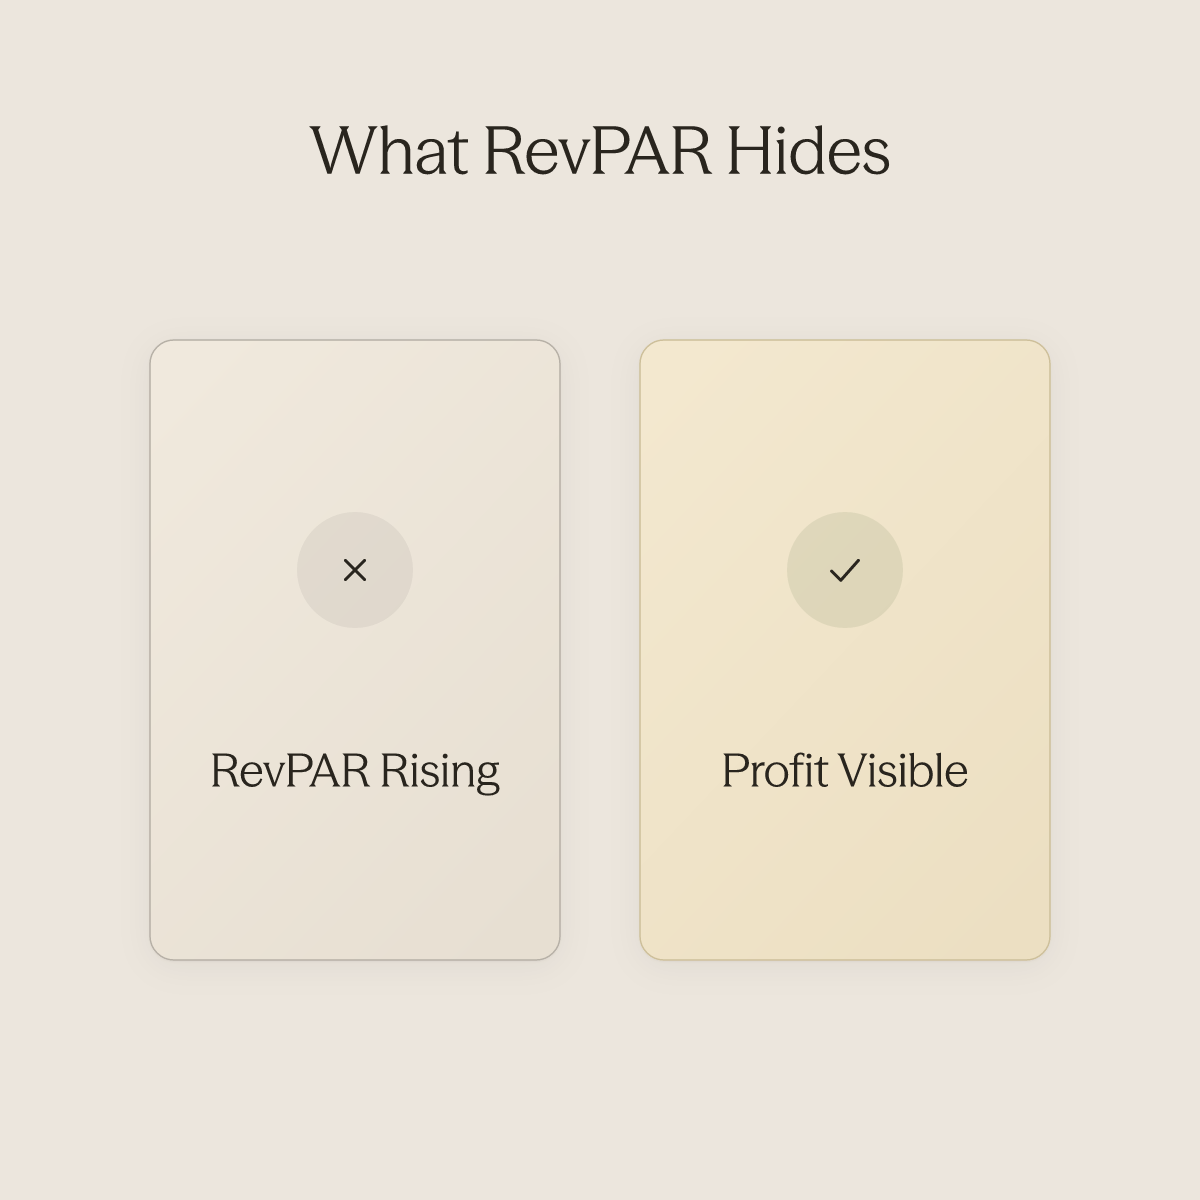
Most hospitality business owners think that if their RevPAR isn't moving, they need to adjust their pricing strategy or their channel mix, those are the two levers they control. But healthy RevPAR numbers can be the most expensive kind of false confidence an operator carries into a Monday morning ownership call. The metric tells you how much room revenue your property generated per available room, but it says nothing about how much of that revenue actually survived the journey from booking to bank account. Understanding where RevPAR goes quiet is the difference between managing a dashboard and managing a business. The deeper problem is structural, not incidental. TRevPAR and GOPPAR are not merely "more complete" versions of RevPAR, they reveal that the ancillary and cost layers RevPAR ignores are precisely where AI-driven guest communication generates its highest-leverage revenue impact, meaning operators benchmarking only RevPAR are measuring the one dimension of their business least sensitive to communication execution. An increase in RevPAR does not necessarily mean higher profits. Consider a property that raises its Average Daily Rate by 15 percent. RevPAR climbs, the dashboard looks strong, and the ownership report goes out with a green arrow. But if filling those rooms required last-minute staff overtime and the bulk of new bookings came through OTA channels, net operating income can land flat or lower than the month before. RevPAR registered the win. The profit-and-loss statement told a different story. The metric captures top-line room revenue, not what remains after the costs that made that revenue possible. Operators who benchmark success on RevPAR alone are measuring the output of a process whose inputs are quietly working against them.
RevPAR Is Blind to Operating Costs, Labor, OTA Commissions, and the Margin Illusion
RevPAR does not account for operating costs, and two cost lines in particular make that silence expensive. Labor consistently represents one of the largest cost categories in hospitality operations. When RevPAR rises because a property pushed hard to fill rooms through aggressive staffing or extended service hours, the headline number improves while the margin underneath compresses. OTA commissions compound the problem. According to EHL Insights, OTAs typically charge hotels commission rates of 15 to 25 percent per booking. That cost sits entirely beneath the RevPAR line. Operators who shift channel mix toward OTAs to lift occupancy may be trading margin for the appearance of momentum. Every direct booking captured instead of an OTA referral improves GOPPAR without moving RevPAR at all, a gain that standard benchmarking will never surface. This is where the structural nature of the problem becomes most visible. The cost of a booking is not just the commission line; it includes the staff time spent answering pre-booking inquiries, managing follow-up messages across multiple platforms, and manually executing touchpoints after check-in. Properties managing guest communications across multiple platforms or properties simultaneously carry a hidden labor overhead that RevPAR never registers. Conduit's AI Agents are most beneficial precisely in this environment: when a business receives a high volume of repetitive guest or customer messages and already has SOPs, FAQs, or manuals that can train the agent. That documentation, whether it lives in Notion, Google Drive, or an Airbnb listing, feeds the agent directly through Conduit's Integrations, so existing content is leveraged without manual re-entry. The result is a guest communication layer that operates continuously, before, during, and after a stay, without adding to the labor line that RevPAR already cannot see. The quality of that layer matters because guests cannot distinguish it from human support. Mayra, Global Head of Customer Experience at Wynwood House, describes it plainly: "The first thing we noticed was the quality of the AI replies. You cannot tell the difference between an AI agent and a human agent. I work with ChatGPT and other AI tools every day, and sometimes you can immediately tell it's AI. With Conduit, we're not seeing that." That distinction is operationally significant. A guest who receives a reply that feels human is more likely to book directly, more likely to ask about ancillary services, and less likely to route their next stay through an OTA, all margin improvements that RevPAR will never credit to the communication stack that drove them. The goal is a systemized, scalable operation that does not depend entirely on owner involvement for every guest touchpoint. Conduit's Inbox gives the operations or support team ongoing visibility to monitor, review, and manage all conversations the AI agent is handling, while Workflows fire automatically after trigger events, a confirmed booking, a check-in, a detected keyword, so recurring guest touchpoints that currently require manual staff action happen without anyone on the team having to remember to send them. The costs RevPAR ignores are exactly where that execution compounds.
Related Reading
- Hotel Budgeting And Forecasting
- Hotel Demand Forecasting
- How To Improve Hotel Operations
- How To Increase Revpar
- Hotel Upselling
- Hotel Revenue Management Strategies
- Automated Hotel Reservation System
- Hotel Guest Messaging
- Hospitality Automation
- Hospitality Operations Management
- Adr Vs Revpar
What Are the Alternatives to RevPAR? (TRevPAR, GOPPAR, and When to Use Each)
(TRevPAR, GOPPAR, and When to Use Each) RevPAR's biggest blind spot is not what it measures, it's what it quietly ignores. And nowhere is that blind spot more consequential than in how response speed compounds invisibly into revenue outcomes: inquiry response speed is not a hospitality courtesy variable but a compounding revenue multiplier. Hotels that respond to inquiries within five minutes are far more likely to convert that lead, and slow responders face algorithmic distribution penalties from OTA platforms that suppress future demand exposure. A single staffing gap during off-hours does not just lose one booking, it degrades the listing's visibility rank for subsequent guests, creating a cascading RevPAR drag that no pricing tool, rate strategy, or channel manager can retroactively correct. That same logic applies to how operators read performance metrics. Two properties can post identical RevPAR figures while sitting at completely different financial positions: one profitable, one quietly bleeding margin through untracked ancillary revenue and rising operating costs. That gap is exactly what TRevPAR and GOPPAR are built to surface. TRevPAR (Total Revenue per Available Room) adds every dollar the property earns beyond the room rate, food and beverage, spa, parking, paid early check-ins, into a single per-room figure. GOPPAR (Gross Operating Profit per Available Room) goes further, subtracting operating expenses to show what the property actually keeps. Together, they give operators a complete financial picture that RevPAR alone will never deliver.
1. TRevPAR - Best for Full-Service Hotels with Multiple Revenue Streams
TRevPAR is the right metric when a meaningful share of guest spending happens outside the room. At full-service hotels and resorts, ancillary revenue, F&B, spa, activities, and paid add-ons, routinely represents a significant portion of total property revenue, as broader industry trends consistently show. A boutique hotel with a rooftop bar could show flat RevPAR while TRevPAR climbs 18%, because the real revenue driver was the bar, a pattern that holds across the market, where ancillary revenue routinely represents a significant share of full-service property totals. The tradeoff: TRevPAR requires clean data feeds from every revenue center, which smaller single-property operators may find disproportionate to the insight gained. Where that data burden compounds is in guest communication. Operators managing ancillary revenue touchpoints, pre-arrival upsells, spa booking confirmations, parking add-ons, face a high volume of recurring, predictable guest messages that currently require manual staff action at each stage of the guest lifecycle. Conduit's Workflows are built precisely for this: after a trigger event such as a booking confirmation or check-in, automated sequences fire without staff intervention, ensuring ancillary offers and follow-ups reach guests consistently across every stay. Conduit's Integrations pull existing SOPs and content directly into the AI agent, so the system leverages documentation already in place without requiring manual re-entry, making the operational lift of tracking multi-touchpoint revenue meaningfully lighter.
2. GOPPAR - Best for Ownership and Asset Management Decision-Making
GOPPAR is the metric ownership groups and asset managers reach for when the conversation shifts from revenue to returns. By folding operating expenses into the calculation, it connects directly to NOI and investor reporting in a way RevPAR and TRevPAR cannot. What most ownership groups report is that operating expenses consume a substantial share of total hotel revenue, meaning strong RevPAR can still deliver thin or negative GOP. Conduit creates direct GOPPAR impact. Conduit's AI Agents handle repetitive guest messages continuously before, during, and after a stay without adding headcount. The Inbox gives the operations or support team a single place to monitor, review, and manage every conversation the AI agent is handling across all properties, keeping oversight centralized even as the portfolio grows. The result is a GOP structure where communication labor does not scale linearly with room count, which is exactly the kind of operating leverage GOPPAR is designed to surface.
3. RevPAR vs. GOPPAR as Strategic Metrics - When to Use Each Based on Management Goals
Choosing between RevPAR and GOPPAR depends on your strategic lens: RevPAR suits short-term pricing and occupancy decisions, while GOPPAR aligns with long-term profitability and investor reporting. Research published in the Journal of Revenue and Pricing Management confirms neither metric is universally superior, context determines fit. The tradeoff is that using only one metric creates blind spots; sophisticated revenue teams track both in tandem for a complete performance picture.
How to Improve RevPAR - Including the Operational Lever Most Operators Ignore
Pricing strategy gets most of the attention when RevPAR stalls. Operators audit dynamic pricing rules, renegotiate OTA commission tiers, and tighten minimum stay requirements, and those moves are worth making. But for most lean operations, the bigger gap sits somewhere the pricing dashboard never looks: the guest who sent a booking inquiry at 1am and booked somewhere else by morning.
The Standard RevPAR Improvement Playbook
Dynamic pricing, demand forecasting, channel mix optimization, and length-of-stay controls form the core of most hotel revenue strategies. Studies on dynamic pricing consistently show meaningful RevPAR lift when rates respond to real-time demand signals rather than static seasonal schedules. Shifting direct booking share away from high-commission OTA channels compounds that gain by improving net revenue per booking. These are legitimate, well-documented levers, and operators who haven't optimized them should start there.
Where Rate Optimization Hits Its Ceiling
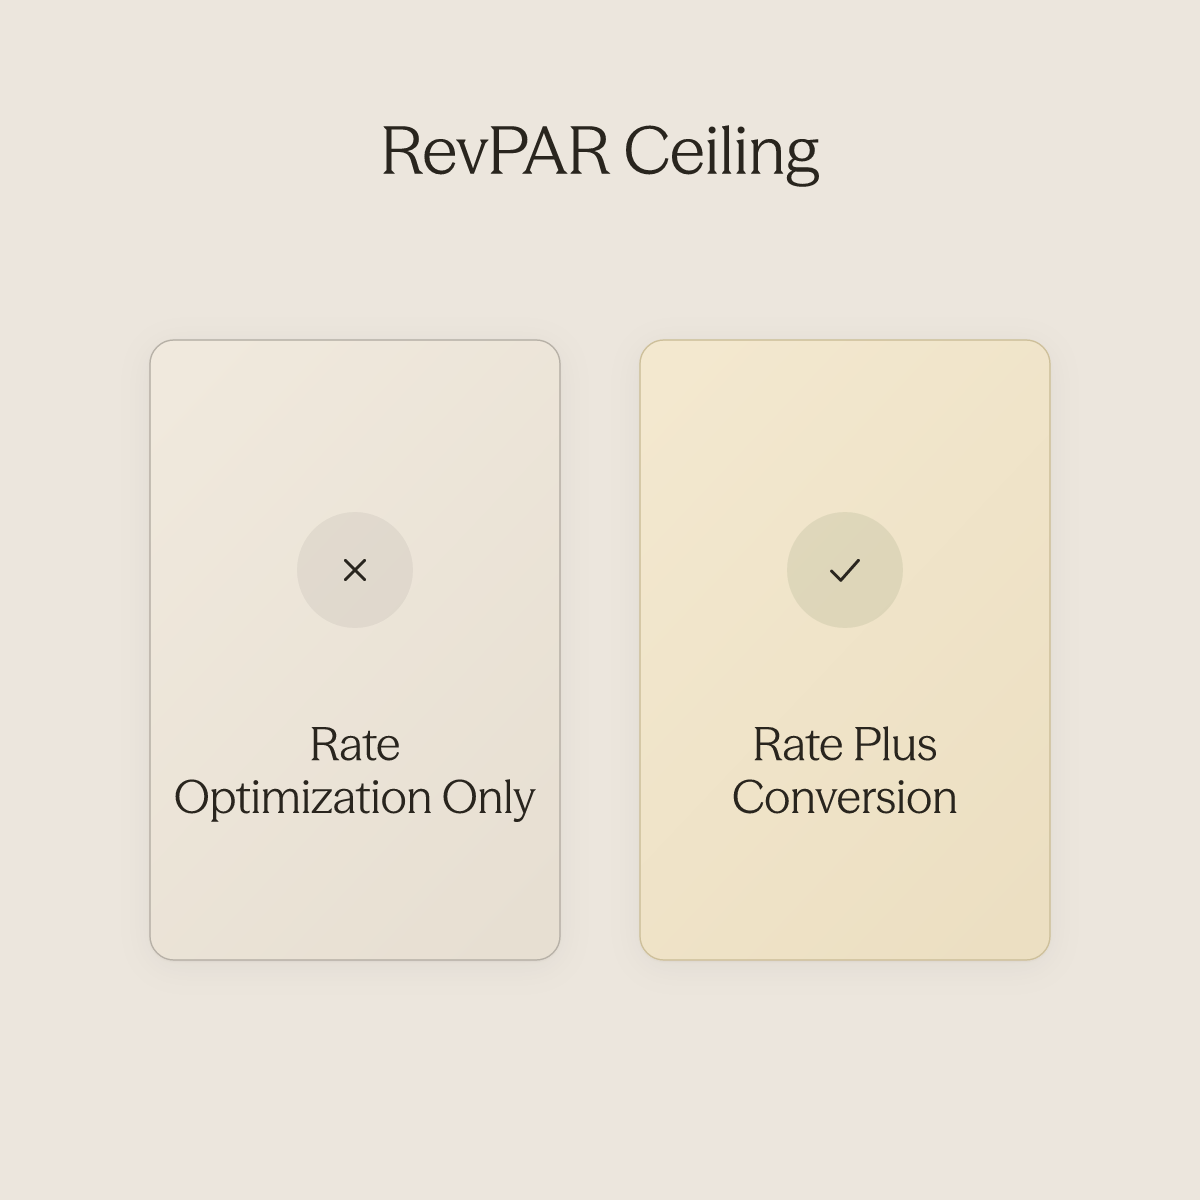
Pricing tools optimize for a room's rate potential, not its conversion probability. Once your rates are competitive and your channel mix is clean, you've set the ceiling. How close you get to that ceiling depends on execution: specifically, whether every inquiry actually converts into a confirmed booking. Operators managing multiple properties often describe the same frustration, messages falling through the cracks, without realizing each crack is a unit of suppressed occupancy the RevPAR formula will quietly absorb.
How Inquiry Response Speed Affects RevPAR - The Conversion Window
Fast response times can boost bookings by as much as 116% for short-term rentals. A room priced perfectly at 11pm that goes unbooked because no one answered a 1am message is a RevPAR suppressor no dynamic pricing tool can see, measure, or fix. Platform algorithms compound the problem: slow responders lose listing visibility, meaning communication speed affects demand exposure, not just conversion rate.
Real Operator Results - Easy BnB and Cascadia Getaways
The operators who close this gap don't do it by changing their pricing strategy. Easy BnB, a 75-unit short-term rental operation, saved approximately $22,000 per month and scaled to manage those 75 units without a single additional hire by ensuring every inquiry received an immediate response regardless of the hour. Both operators closed the inquiry-conversion gap through hospitality-specific AI agents trained on their own SOPs, not by revisiting their rate strategy.
RevPAR and Operational Execution - What Pricing Tools Cannot Fix
The honest trade-off: this approach requires upfront investment in building a reliable AI knowledge base, and it works best for operators handling consistent inquiry volume across multiple units or time zones. A single-property owner with low overnight inquiry volume may see less immediate impact. But for anyone managing a portfolio and still answering guests at 2am, the operational fix is higher-leverage than another pricing adjustment. RevPAR gives you the score, but the score only reflects the bookings you actually captured, and the next section is a practical starting point for identifying exactly where that revenue potential is leaking. "Hotel operators struggle with optimizing multiple RevPAR-related metrics simultaneously (ADR, RevPAR, Occupancy, Total Revenue), suggesting a lack of integrated operational strategy." 60% of guest communications and maintained a 4
Related Reading
- Digital Concierge Software
- Best Hotel Channel Manager Software
- Hospitality Chatbot
- Hotel Distribution Management
- Hospitality Conferences
- Best Revenue Management Software For Hotels
- Siteminder Competitors
- Canary Technologies Competitors
- Cloudbeds Alternatives
Next steps
If your RevPAR has plateaued despite clean pricing and a tuned channel mix, the path forward starts with recognizing that RevPAR is a lagging output, not a leading lever. The score only reflects bookings you actually captured, and every inquiry that sat unanswered overnight never entered the calculation. Start with our AI for hospitality. The dual-formula problem means a stable RevPAR number can be produced by a dozen different ADR and occupancy combinations, making it impossible to diagnose whether you have a pricing failure or a fill-rate failure from the headline figure alone. And because OTA-driven RevPAR growth locks in 15 to 25 percent commission costs that RevPAR never nets out, operators using it as their primary health signal systematically over-invest in the channel mix that is quietly compressing their NOI. Together, those two blind spots point to the same corrective action: fix the execution layer before touching the rate strategy again. Start with conduit.ai to see how operators like Easy BnB and Cascadia Getaways closed the inquiry-conversion gap without adding headcount. Once the AI Agent is trained on your existing SOPs and FAQs, the first automated guest reply goes live within days, and from that point every inquiry gets a substantive response regardless of the hour, every recurring guest touchpoint fires automatically, and the Inbox gives your team full visibility across every conversation, so the communication layer that RevPAR cannot see stops leaking revenue it will never credit back to you.
Frequently Asked Questions
What is the difference between ADR and RevPAR?
ADR (Average Daily Rate) measures only the average price of rooms that actually sold, while RevPAR divides total room revenue by all available rooms, including the ones that went unsold. That means RevPAR captures both your pricing performance and your fill rate in a single number, while ADR tells you nothing about how many rooms sat empty.
What does RevPAR actually tell you about your property's performance?
RevPAR tells you how effectively you are converting your total available room inventory into actual revenue across a given period. When you break it into its two inputs, ADR and occupancy, it also reveals which of the two is the source of any underperformance: a fill-rate problem or a pricing problem, which determines which lever you should pull next.
Can RevPAR go up while my actual profit goes down?
Yes. If rooms are filled through OTA channels, commissions of 15 to 25 percent per booking sit entirely beneath the RevPAR line, so a rising RevPAR can coincide with compressed net operating income. Similarly, if filling rooms required last-minute staff overtime, the headline number improves while the margin underneath it does not, RevPAR captures top-line room revenue, not what survives after the costs that made that revenue possible.
What are the main limitations of using RevPAR as your primary performance metric?
RevPAR has three core blind spots: it cannot distinguish between a pricing failure and a fill-rate failure without being broken into its ADR and occupancy components; it is invisible to operating costs like labor and OTA commissions that directly affect profit; and it excludes all non-room revenue, meaning ancillary income streams never enter the calculation. Metrics like GOPPAR and TRevPAR exist precisely because they capture the cost and total-revenue layers that RevPAR ignores.
Is there a single RevPAR number that counts as 'good'?
There is no universal threshold, because a raw RevPAR number is genuinely misleading without context. The post points to the RevPAR Index (also called the Revenue Generation Index, or RGI) as the more meaningful benchmark: an RGI of 100 means your property is capturing exactly its fair share relative to your competitive set, above 100 means you are outperforming it, and below 100 means the competitive set is taking share you should be capturing.
Stay in the loop
Get the latest on AI automation, product updates, and customer stories.


